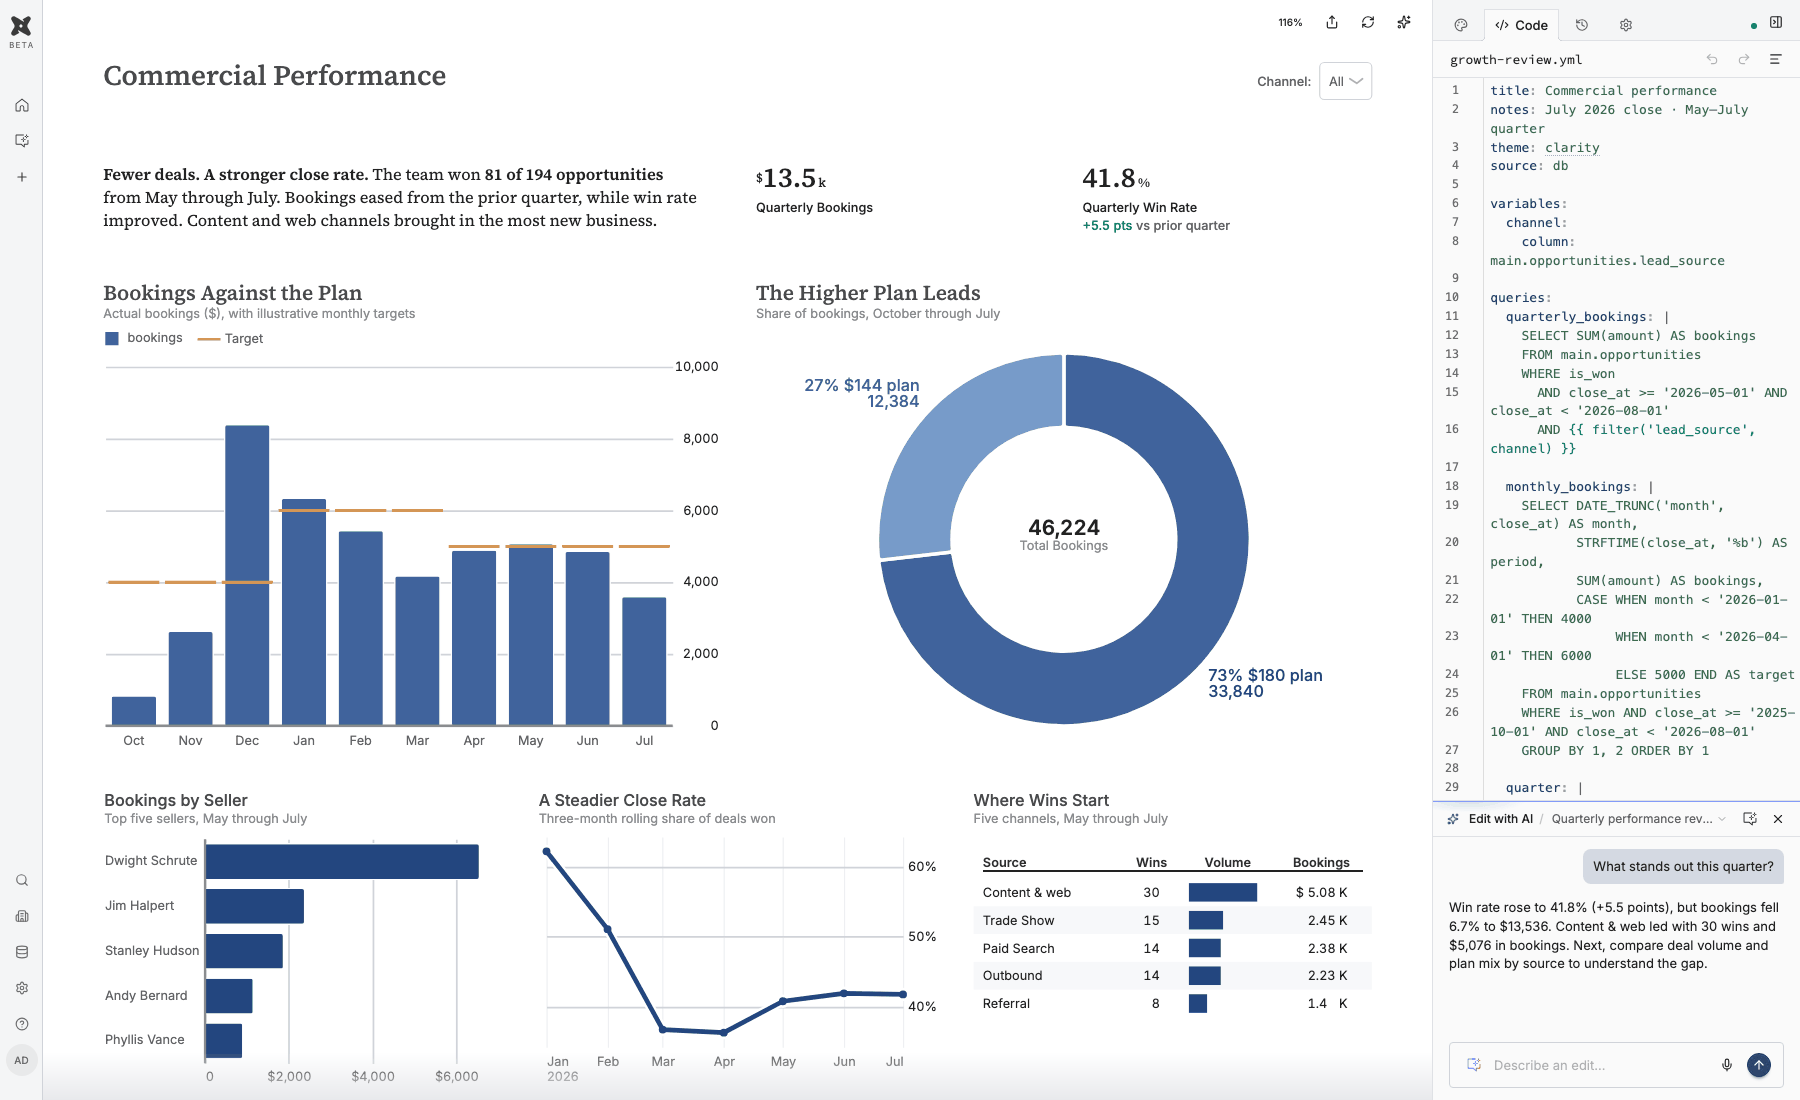
title: Commercial performance
notes: July 2026 close · May–July quarter
theme: clarity
source: db
variables:
  channel:
    column: main.opportunities.lead_source
queries:
  quarterly_bookings: |
    SELECT SUM(amount) AS bookings
    FROM main.opportunities
    WHERE is_won
      AND close_at >= '2026-05-01' AND close_at < '2026-08-01'
      AND {{ filter('lead_source', channel) }}⋯ 6 more queries  monthly_bookings: |
    SELECT DATE_TRUNC('month', close_at) AS month,
           STRFTIME(close_at, '%b') AS period,
           SUM(amount) AS bookings,
           CASE WHEN month < '2026-01-01' THEN 4000
                WHEN month < '2026-04-01' THEN 6000
                ELSE 5000 END AS target
    FROM main.opportunities
    WHERE is_won AND close_at >= '2025-10-01' AND close_at < '2026-08-01'
    GROUP BY 1, 2 ORDER BY 1
  quarter: |
    WITH periods AS (
      SELECT CASE WHEN close_at >= '2026-05-01' THEN 'current' ELSE 'prior' END AS period,
             COUNT(*) FILTER (WHERE is_won)::DOUBLE / COUNT(*) AS win_rate
      FROM main.opportunities
      WHERE is_closed AND close_at >= '2026-02-01' AND close_at < '2026-08-01'
      GROUP BY 1
    )
    SELECT current.win_rate,
           100 * (current.win_rate - prior.win_rate) AS win_rate_change
    FROM periods current JOIN periods prior ON prior.period = 'prior'
    WHERE current.period = 'current'
  plan_mix: |
    SELECT '$' || amount::INTEGER || ' plan' AS plan,
           SUM(amount) AS bookings
    FROM main.opportunities
    WHERE is_won AND close_at >= '2025-10-01' AND close_at < '2026-08-01'
    GROUP BY 1 ORDER BY 2 DESC
  seller_bookings: |
    SELECT owner_name AS seller, SUM(amount) AS bookings
    FROM main.opportunities
    WHERE is_won AND close_at >= '2026-05-01' AND close_at < '2026-08-01'
    GROUP BY 1 ORDER BY 2 DESC LIMIT 5
  win_rate_trend: |
    WITH monthly AS (
      SELECT DATE_TRUNC('month', close_at) AS month,
             COUNT(*) FILTER (WHERE is_won) AS won, COUNT(*) AS closed
      FROM main.opportunities
      WHERE is_closed AND close_at >= '2025-10-01' AND close_at < '2026-08-01'
      GROUP BY 1
    ), rolling AS (
      SELECT month,
             SUM(won) OVER (ORDER BY month ROWS BETWEEN 2 PRECEDING AND CURRENT ROW)
               / SUM(closed) OVER (ORDER BY month ROWS BETWEEN 2 PRECEDING AND CURRENT ROW) AS win_rate
      FROM monthly
    )
    SELECT * FROM rolling WHERE month >= '2026-01-01' ORDER BY month
  top_sources: |
    SELECT CASE WHEN lead_source IN ('Website', 'Download', 'Webinar')
                THEN 'Content & web' ELSE lead_source END AS source,
           COUNT(*) AS wins,
           COUNT(*) AS wins_bar,
           SUM(amount)::INTEGER AS bookings
    FROM main.opportunities
    WHERE is_won AND close_at >= '2026-05-01' AND close_at < '2026-08-01'
    GROUP BY 1 ORDER BY 2 DESC, 4 DESC
charts:
  bookings:
    type: kpi
    query: quarterly_bookings
    label: Quarterly bookings
    value: bookings
    style:
      value:
        format: currency⋯ 6 more charts  win_rate:
    type: kpi
    query: quarter
    label: Quarterly win rate
    value: win_rate
    style:
      value:
        format: percent
    support:
      value: win_rate_change
      label: vs prior quarter
      format: percentage_points_delta
      tone: positive
  mix:
    title: The higher plan leads
    subtitle: Share of bookings, October through July
    type: donut
    query: plan_mix
    theta: bookings
    color: plan
  monthly:
    title: Bookings against the plan
    subtitle: Actual bookings ($), with illustrative monthly targets
    type: bar
    query: monthly_bookings
    x: period
    y: bookings
    layers:
      - type: line
        y: target
        label: Target
        style:
          marks:
            line:
              stroke:
                color: category.gold
              curve: step
              connect: false
  sources:
    title: Where wins start
    subtitle: Five channels, May through July
    type: table
    query: top_sources
    style:
      columns:
        wins_bar:
          label: Volume
          spark:
            type: bar
        bookings:
          format: currency
  seller_bookings:
    title: Bookings by seller
    subtitle: Top five sellers, May through July
    type: bar
    query: seller_bookings
    x: seller
    y: bookings
    style:
      number_format: currency
  close_rate:
    title: A steadier close rate
    subtitle: Three-month rolling share of deals won
    type: line
    query: win_rate_trend
    x: month
    y: win_rate
    style:
      axis_y:
        labels:
          format: percent_whole
rows:
  - cols:
      - width: 50%
        text: |
          **Fewer deals. A stronger close rate.** The team won **81 of 194
          opportunities** from May through July. Bookings eased from the
          prior quarter, while win rate improved. Content and web
          channels brought in the most new business.
      - bookings
      - win_rate⋯ 3 more rows  - cols: [monthly, mix]
  - cols: [seller_bookings, close_rate, sources]
  - text: |
      **The next question:** Which acquisition channels can deliver more
      qualified opportunities? Figures use fictional company data through
July 31, 2026. Planning targets are illustrative, not observed data.Charts built for Chat
AI agents make an unauditable mess of dashboards. Give them dbt Charts, a simple declarative YAML language, and they build better dashboards you can govern, using fewer tokens.
The open-source language
Every dashboard should show its work.
Queries, charts, layout, and the explanation live in one text file. SQL defines the data, a few declarations describe how to show it, and people and agents read, edit, and review the same file.
How the language works →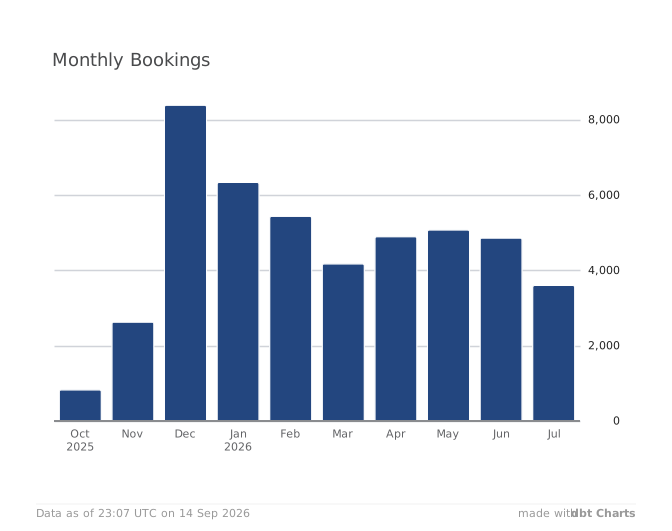
theme: clarity
source: db

queries:
  monthly_bookings: |
    SELECT
      DATE_TRUNC('month', close_at)
        AS month,
      SUM(amount) AS bookings
    FROM main.opportunities
    WHERE is_won
      AND close_at >= '2025-10-01'
      AND close_at < '2026-08-01'
    GROUP BY 1 ORDER BY 1

charts:
  monthly:
    title: Monthly bookings
    type: bar
    query: monthly_bookings
    x: month
    y: bookings

rows:
  - monthly
Confidence should ship with every change.
Validate board structure in CI, then check queries against your dbt models or the warehouse. A missing column fails on the branch, not in front of your readers.
All checks have passed
dbt parse
dct validate charts/
lint
This branch has no conflicts with the base branch
Editorial standards
Good design should be the default.
A good chart makes a comparison easy; a good report says what it means. That craft is built into the defaults, and the renderer flags problems like crowded labels.
Explore charts and themes →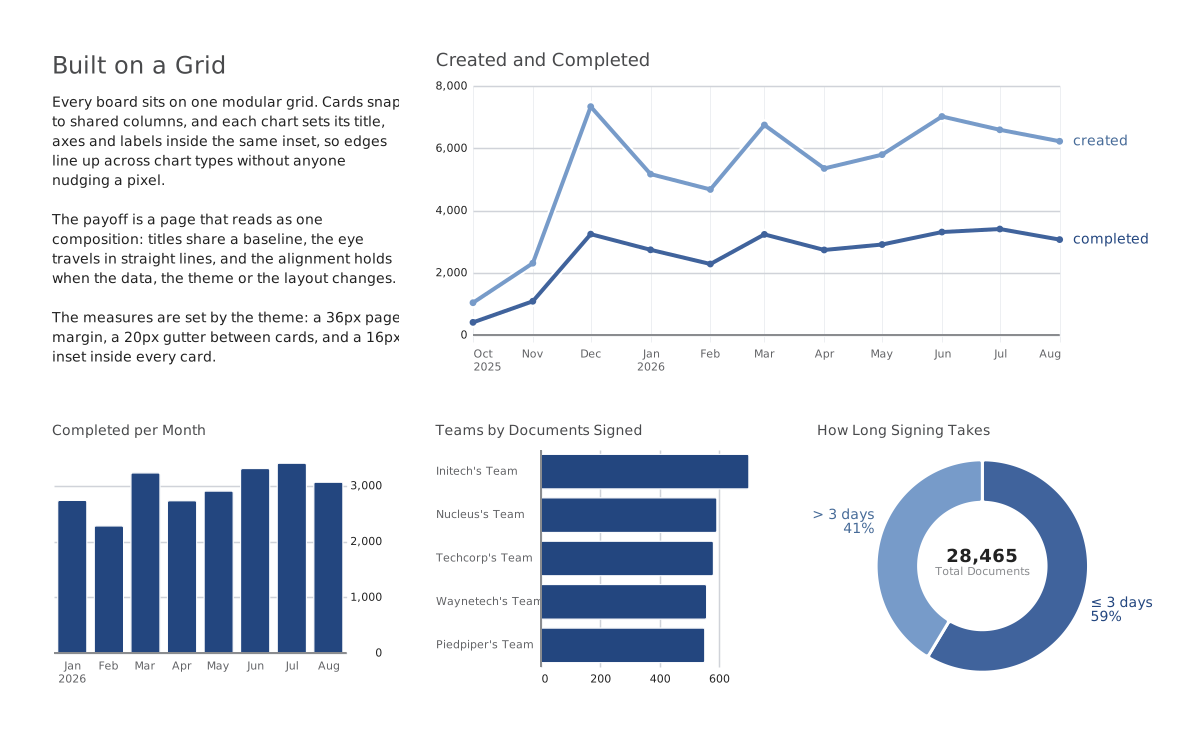
Version control
One workflow for models and charts.
Boards live beside your dbt models, on the same branch, in the same pull request. Run the same board on your laptop, in CI, and on the platform. Apache 2.0.
Explore the open-source project →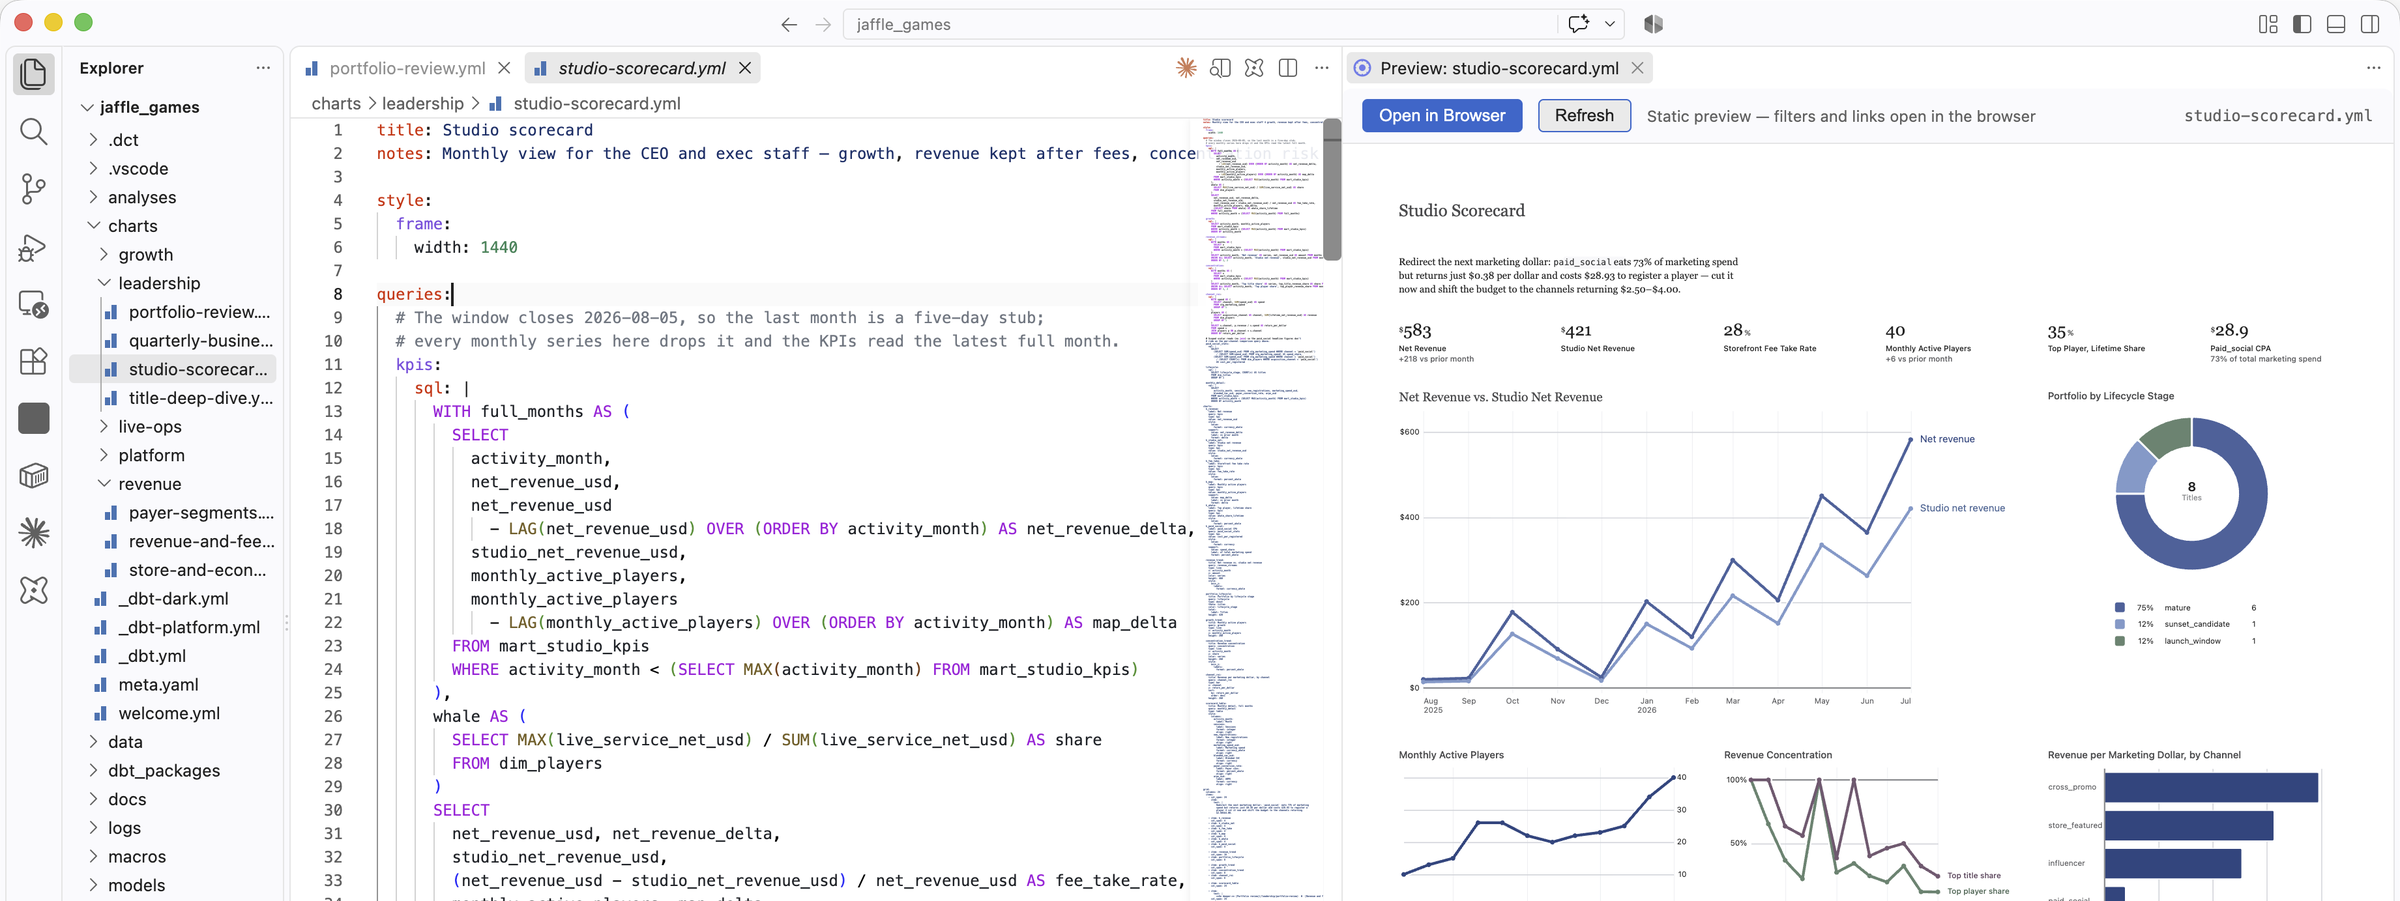
The hosted half
dbtCharts.com
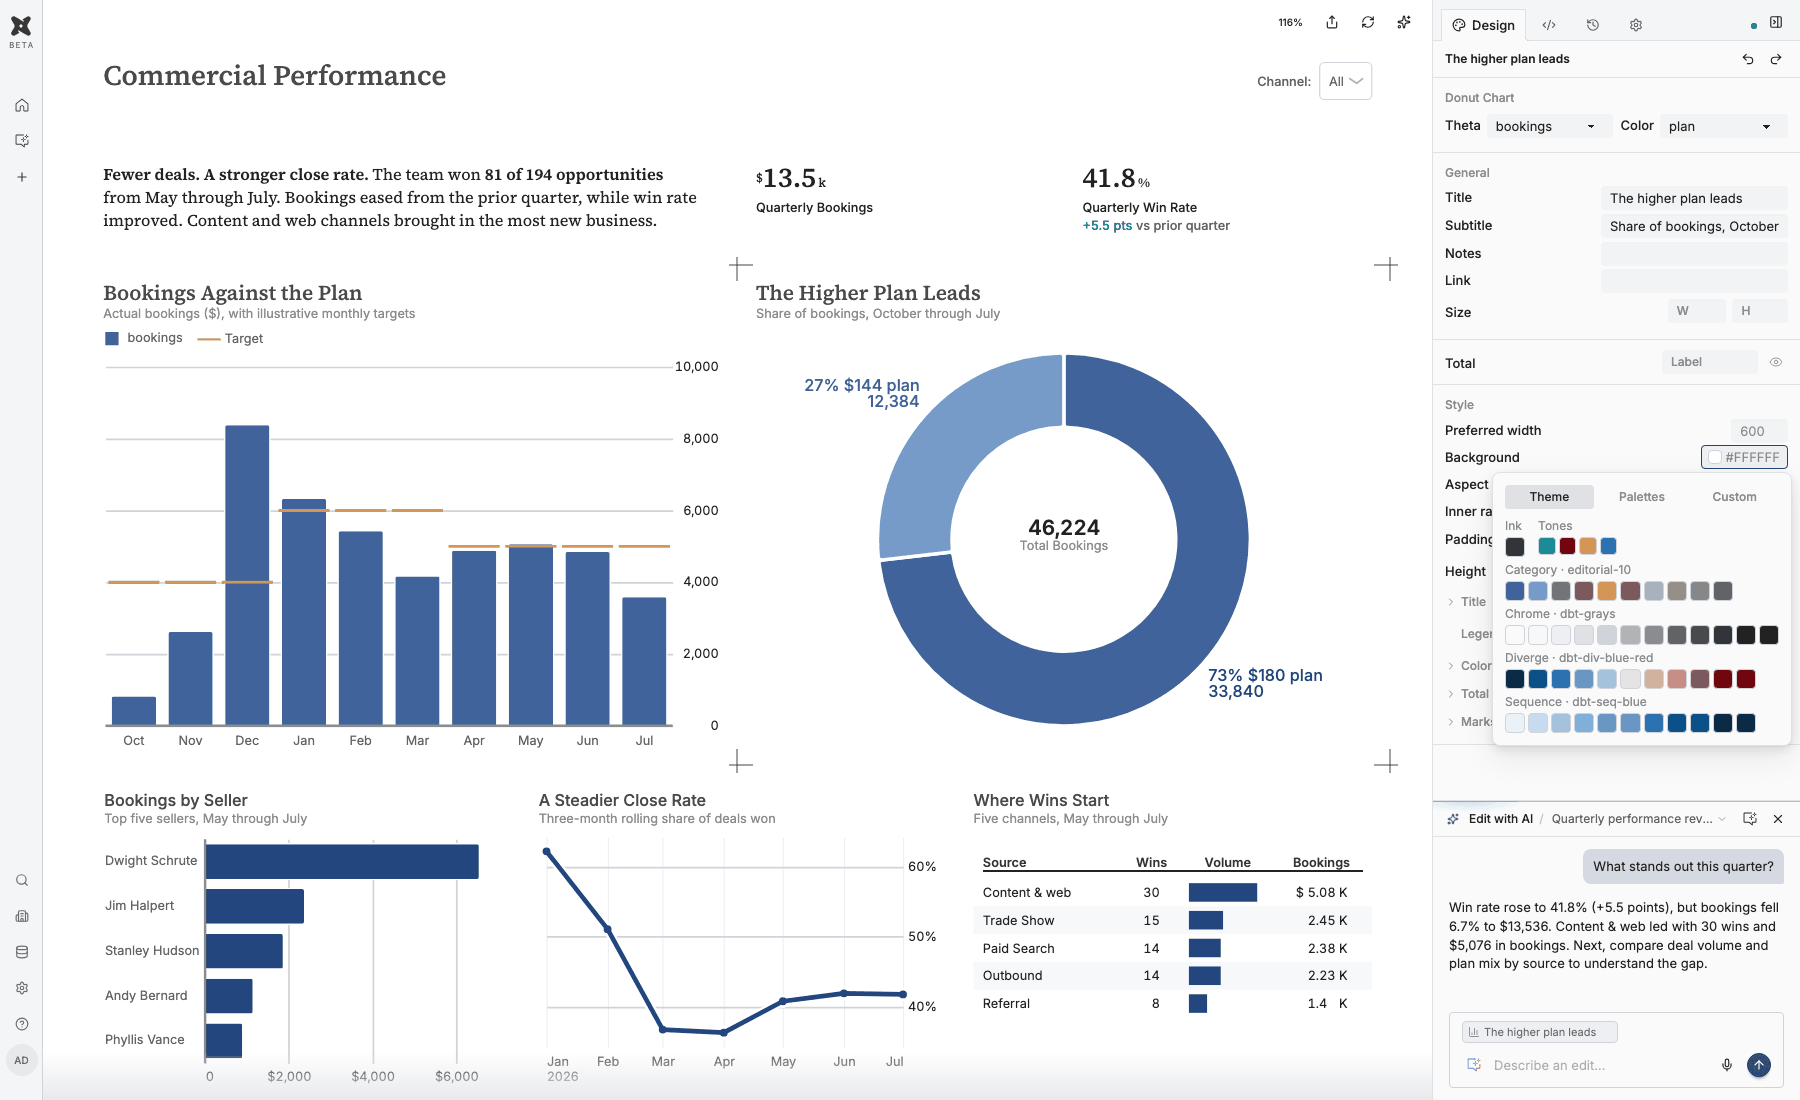
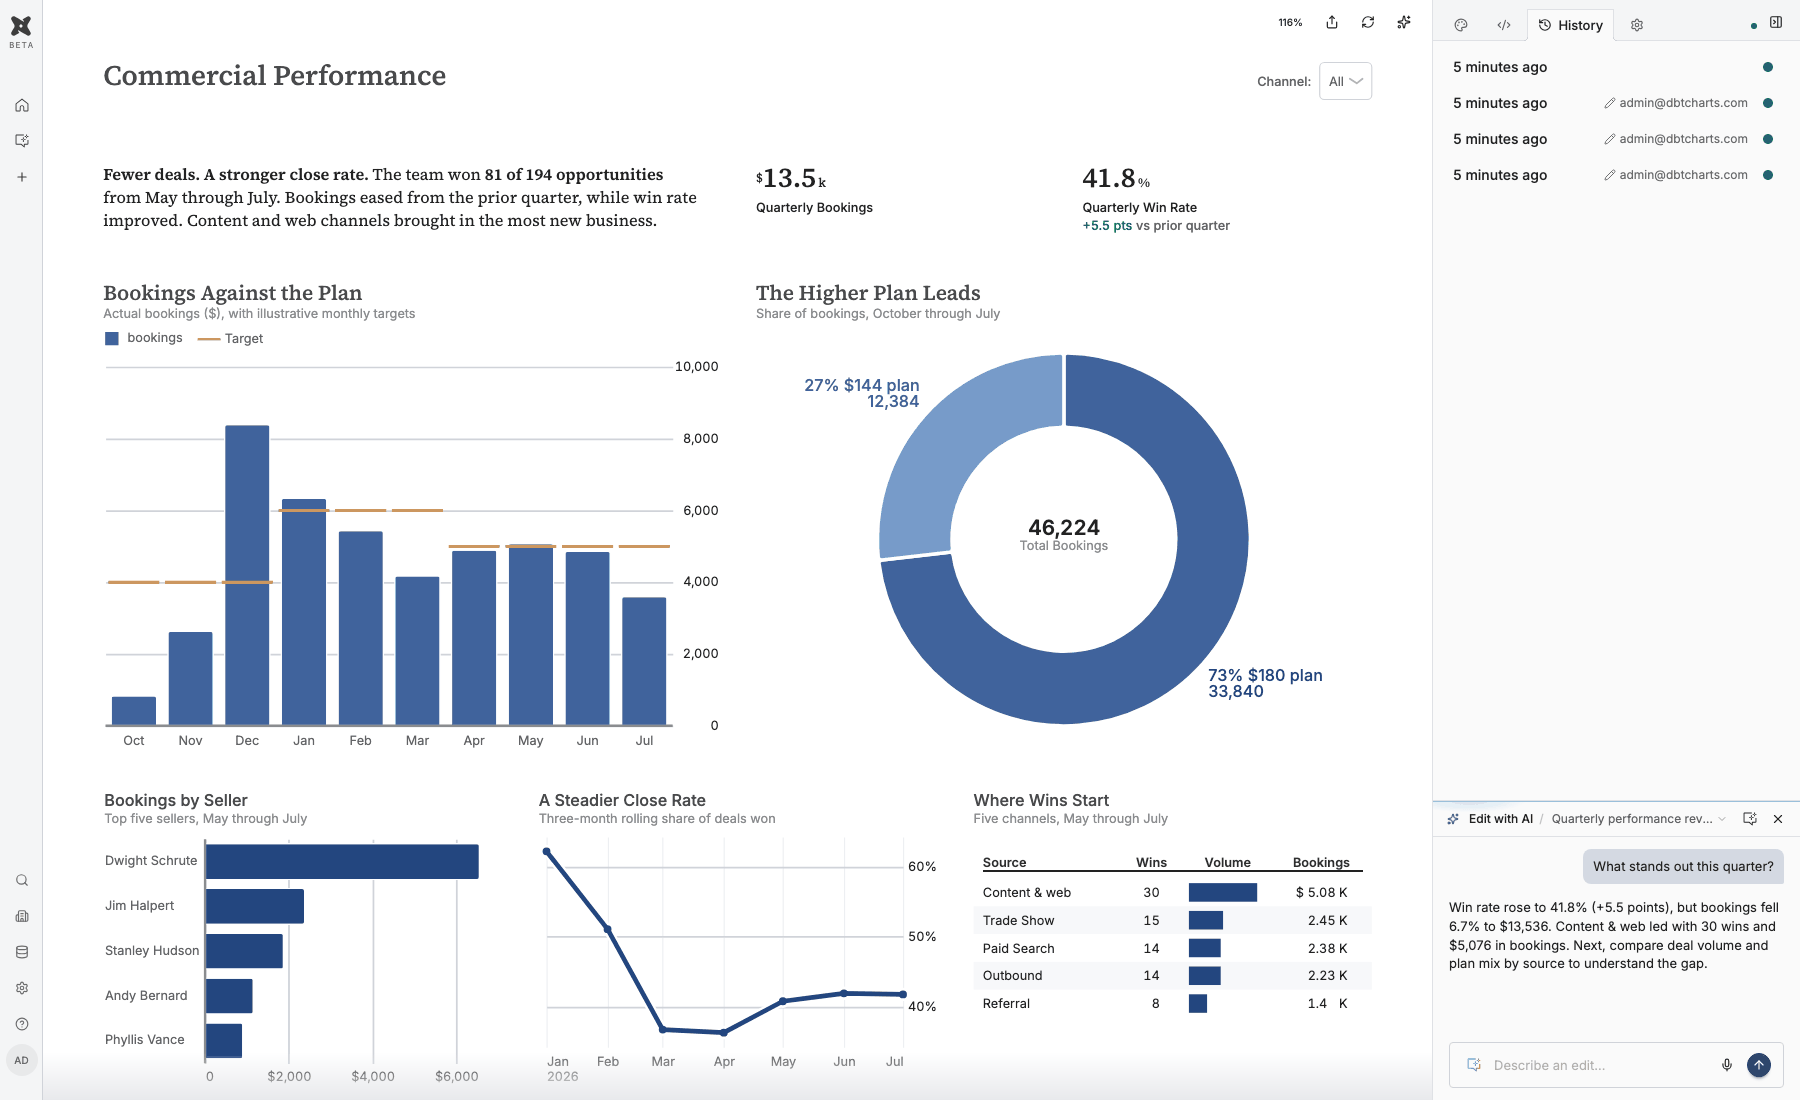
Turn a working board into a shared place for analysis. Build with an agent, refine in the visual editor, publish to the people who rely on it. One open definition connects every step.
Conversational analytics
Ask questions in the platform, or from Claude Code or Codex in your repo. The agent explores your data and builds boards in the same language as your team.
Dashboard editor
Select a chart and adjust it with visual controls, edit the text, or open the YAML. Every change lands in the same board file.
Hosting
Connect your warehouse and serve boards from the platform, with scheduled renders and publishing. Board definitions stay in your Git repo.
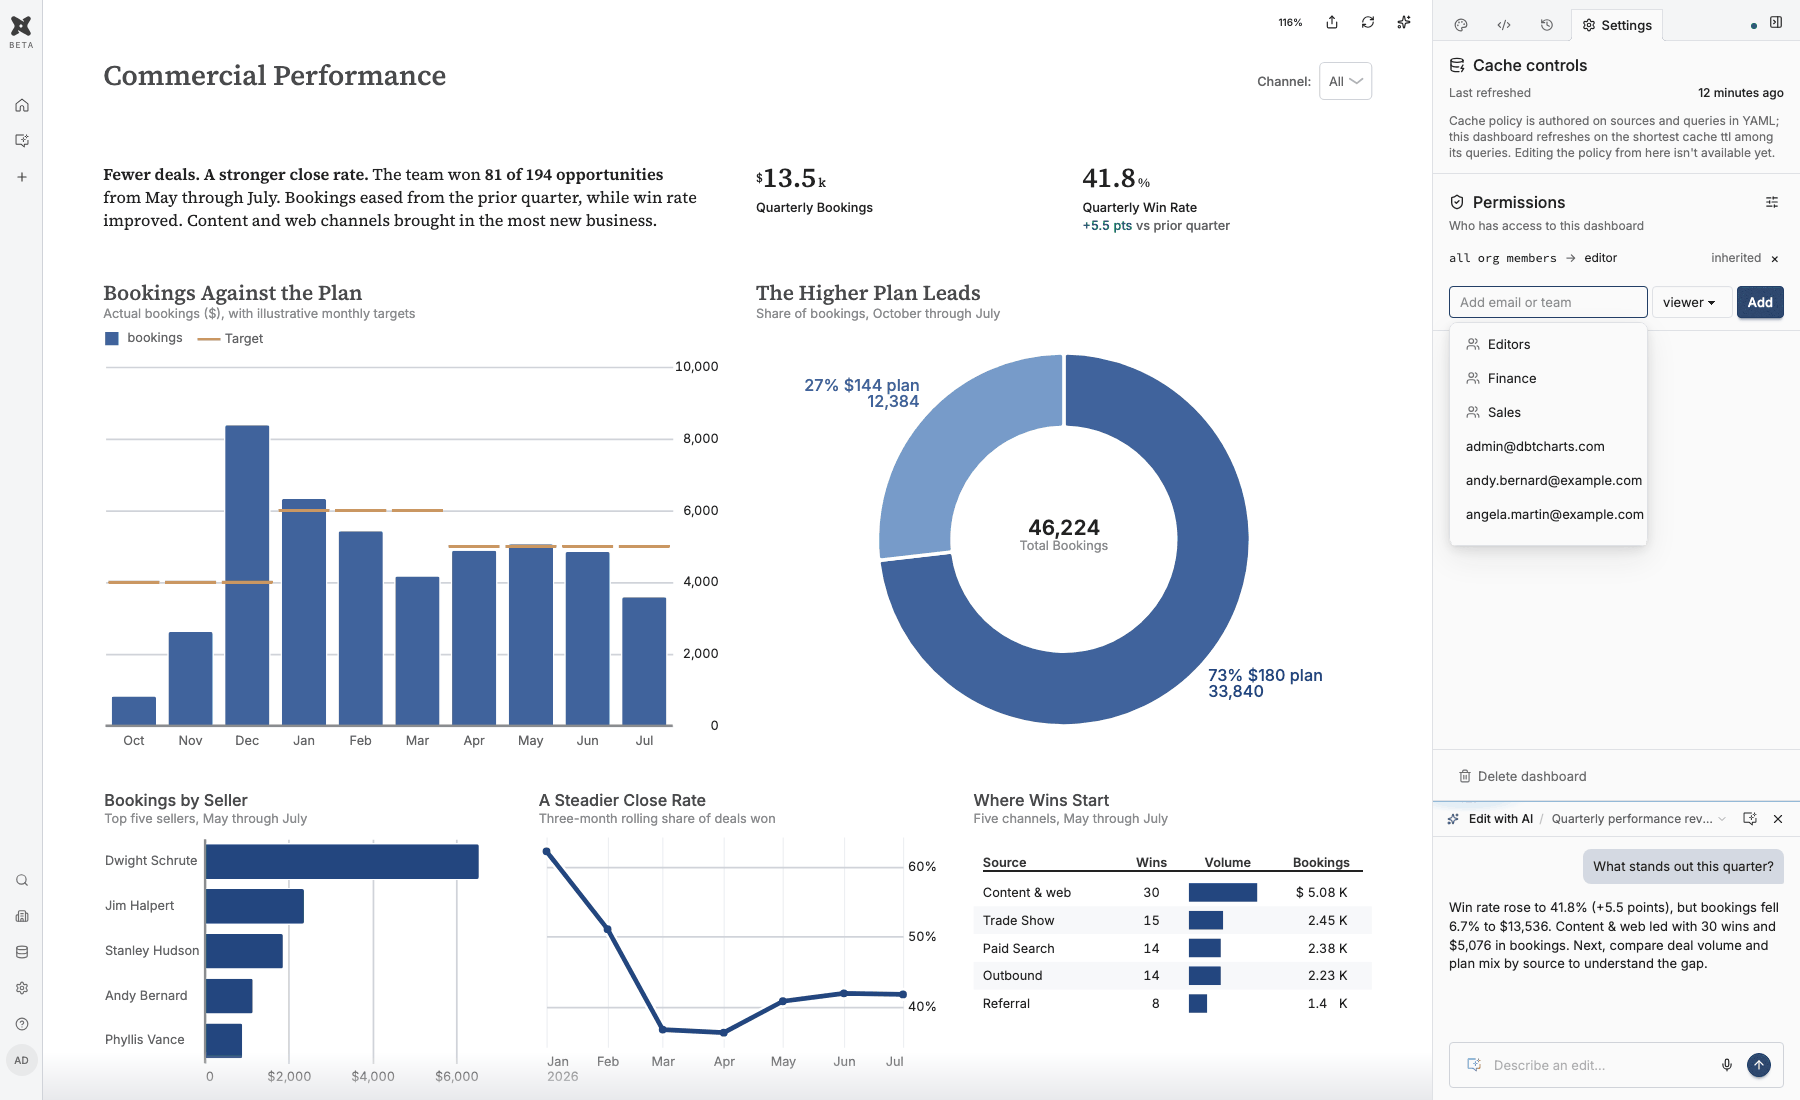
Access controls
Share boards with users and groups, with separate permissions to view, edit, and query. Readers do not need a warehouse login.
Language-first BI.
An open language for the charts. A platform for collaboration, with agents and with each other.
Build your next dashboard on an open foundation.
Start a conversation in the platform, or hand your coding agent the open-source language.
Terminal
uv tool install dbt-charts
Claude / AI
Make charts of this with dbt Charts. Start with: uv tool install dbt-charts && dct skills intro