dbt charts Cloud
BI built backwards
Every BI tool was built front to back: a UI first, a database to hold what people made, an API bolted on years later. We built it the other way round, starting from an open language. Everything that is hard about BI is downstream of that one decision.
Two minutes to a board
One install. One sentence to your agent.
dct is a Python CLI. Install it, then write the YAML yourself
or say the sentence to Claude Code, Codex, or Cursor: the tool teaches the
agent the rest, in your repo or a fresh folder.
uv tool install dbt-chartsMake charts of this with dbt charts. Start with: uv tool install dbt-charts && dct skills introAgents that arrive on their own read dbtcharts.com/llms.txt.
Conversational analytics
Business Intelligence finally living up to its name.
For thirty years "business intelligence" has meant a chart someone built last quarter. The intelligence was always the analyst, and the tool was where their work went to get stale. What is different now is not that a model can draw a bar chart. It is that the analyst's process can be written down, and this is a product an agent can actually operate: the boards are files, the queries are named, the schema is readable, and every action the UI takes is one the agent can take too.
Explore the data first
Before writing anything, it reads your sources, schemas, tables and relationships, so the answer is grounded in the columns you actually have rather than the ones it guessed.
Follow an analyst's process
Triage the request, reuse existing work, pick the right response shape, verify the answer, then deliver it with a written read. Not a chart flung back at you without a sentence explaining it.
Reach for the right shape
Top-N with a detail table, a before-and-after comparison, a faceted small-multiple, a KPI row, a drill-down link. Each is a named pattern with rules about when it is the wrong choice.
Review its own work
A structural pass and a visual pass over the board it just built, merged into one ranked list of findings. The same review you would run on a colleague's dashboard.
These are shipped skills, not prompt suggestions: 24 of them live in the open-source core, so the same agent behaviour runs in Cloud, in the CLI, and in your own editor.
Sharing and access
One copy, and everyone can see it.
Most dashboard sprawl is a permissions problem wearing a costume. When sharing is expensive or fiddly, people export, screenshot and rebuild, and within a quarter there are four revenue numbers and no way to tell which is right.
Send a link, not an export
A board has a URL. The person opening it sees live data at the moment they open it, not a PNG of what was true on Tuesday.
Access per board, not per tool
Org roles set the floor and per-board grants do the rest, so finance can have the finance boards without an account manager and a call.
Reading a board is not warehouse access
Someone can open the board without being able to see the warehouse behind it, so there is no reason to keep an answer in a smaller circle than it deserves.
The workspace is the shared place
Boards live in projects, not in individual people's saved views, so there is one copy of the revenue board and everyone is reading it.
Governance
See what a change does before it ships.
Turn on branch mode and edits stop landing on the live board. They go to a branch, and a review shows the YAML diff beside a picture of the board before and after, so the reviewer is looking at the dashboard rather than imagining it from a diff.
Branch mode
A per-project switch. With it on, nobody edits production by accident: every change is proposed, and merging is a decision somebody made rather than a save that happened.
Visual diffs
Every changed board renders both ways and the review pixel-compares them, so a formatting change nobody meant to make is visible in the place where it would be caught.
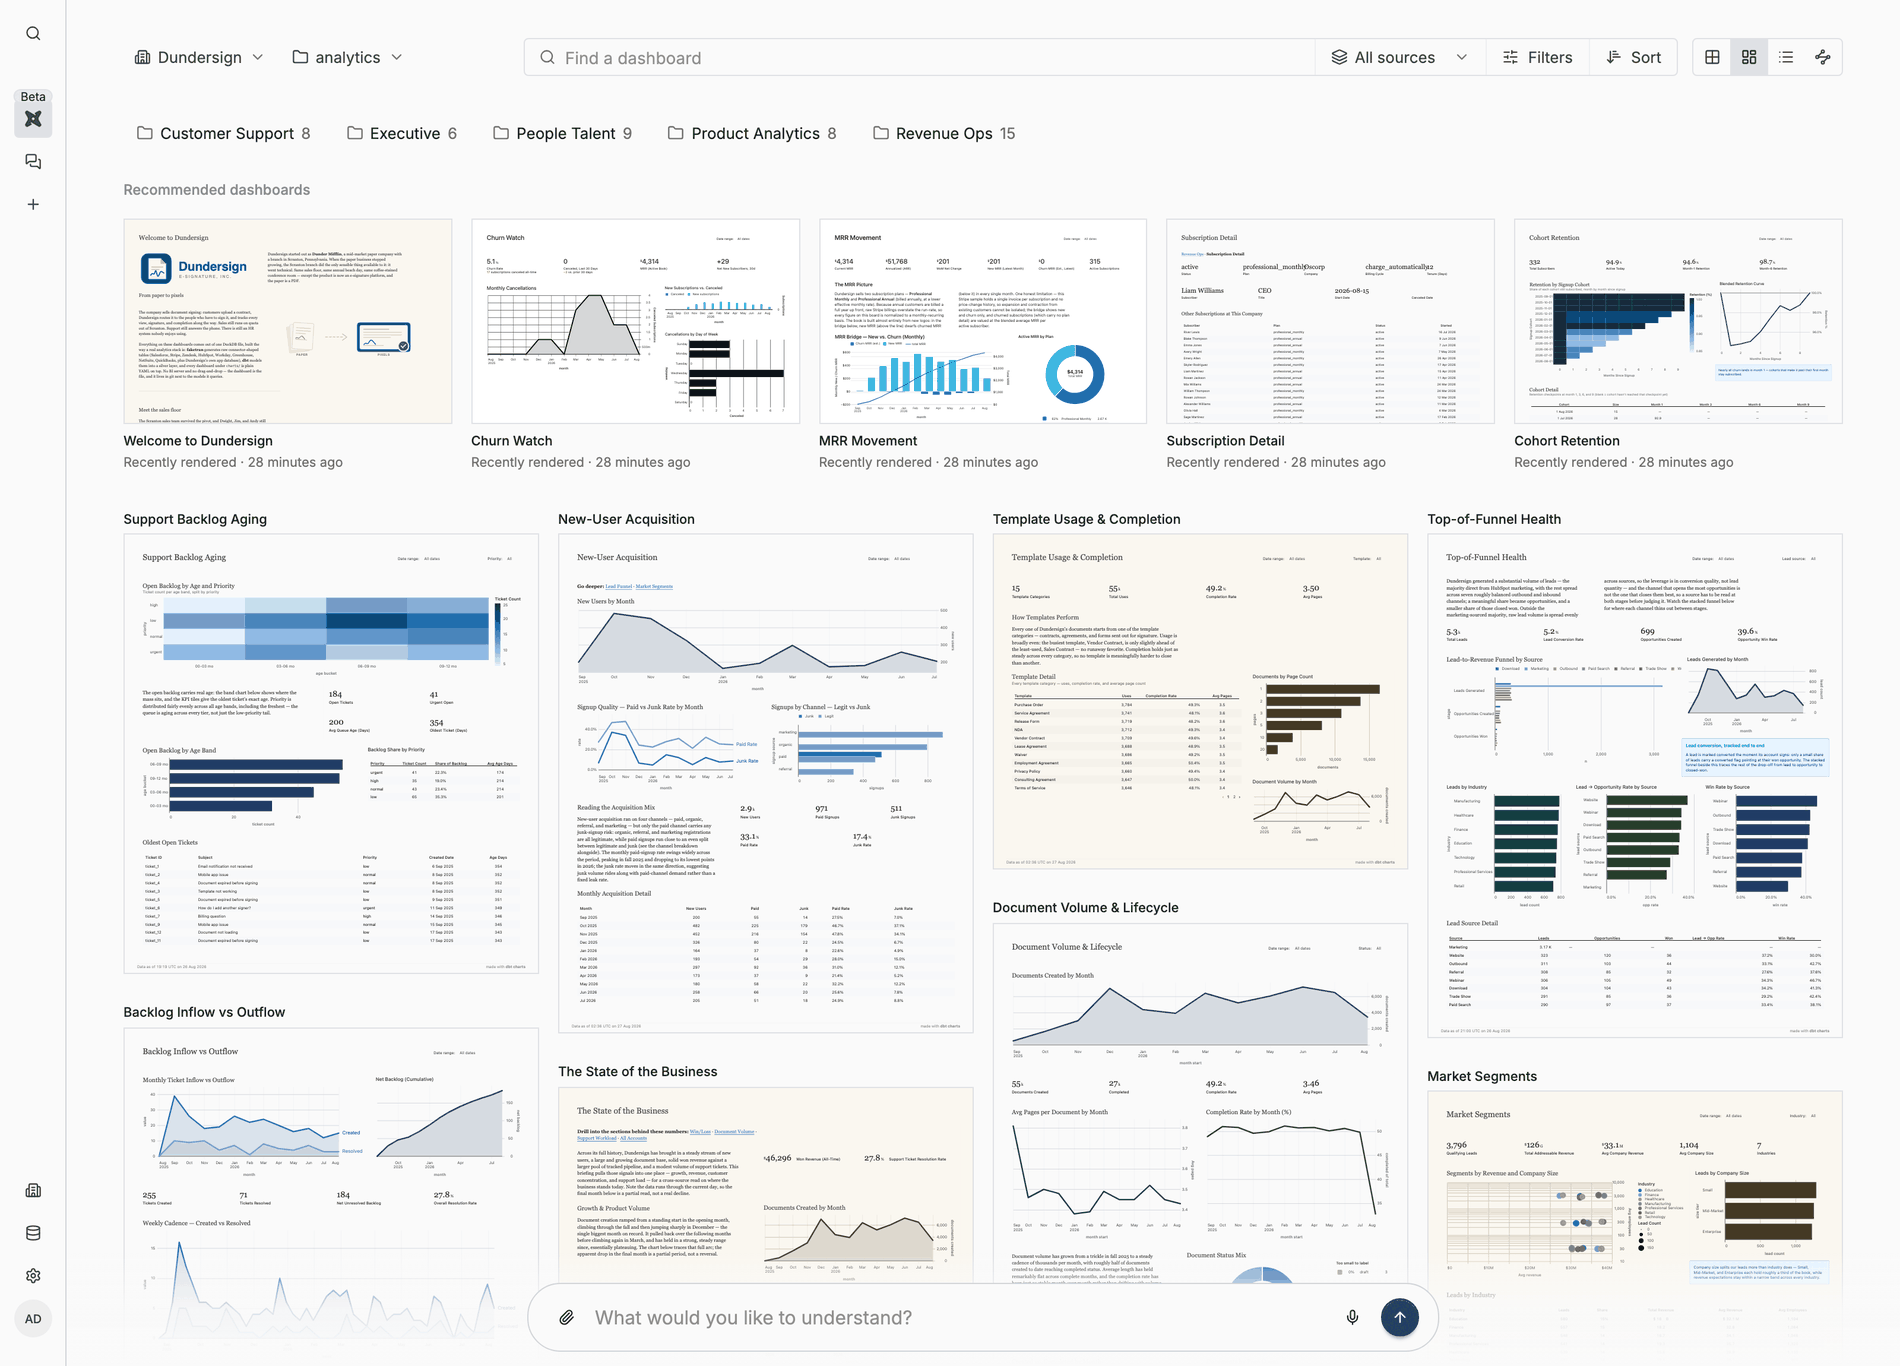
The workspace
Where everyone else meets the work.
Boards organised by project, permissions per board, and a link you can send to someone who will never open the repo.
Change control
A dashboard change is a pull request
Branch, edit, open a PR, have someone read the diff, merge. The board that broke is the line that changed, and reverting is a revert rather than an archaeology project.
CI validates every board against the warehouse schema on the branch, so a renamed column fails the build instead of quietly emptying a tile.
# charts/revenue.yml
-    y: mrr
+    y: mrr_usd
+    format: currency

2 files changed, reviewed by @dave
Conversational analytics
Ask it, and get a board back
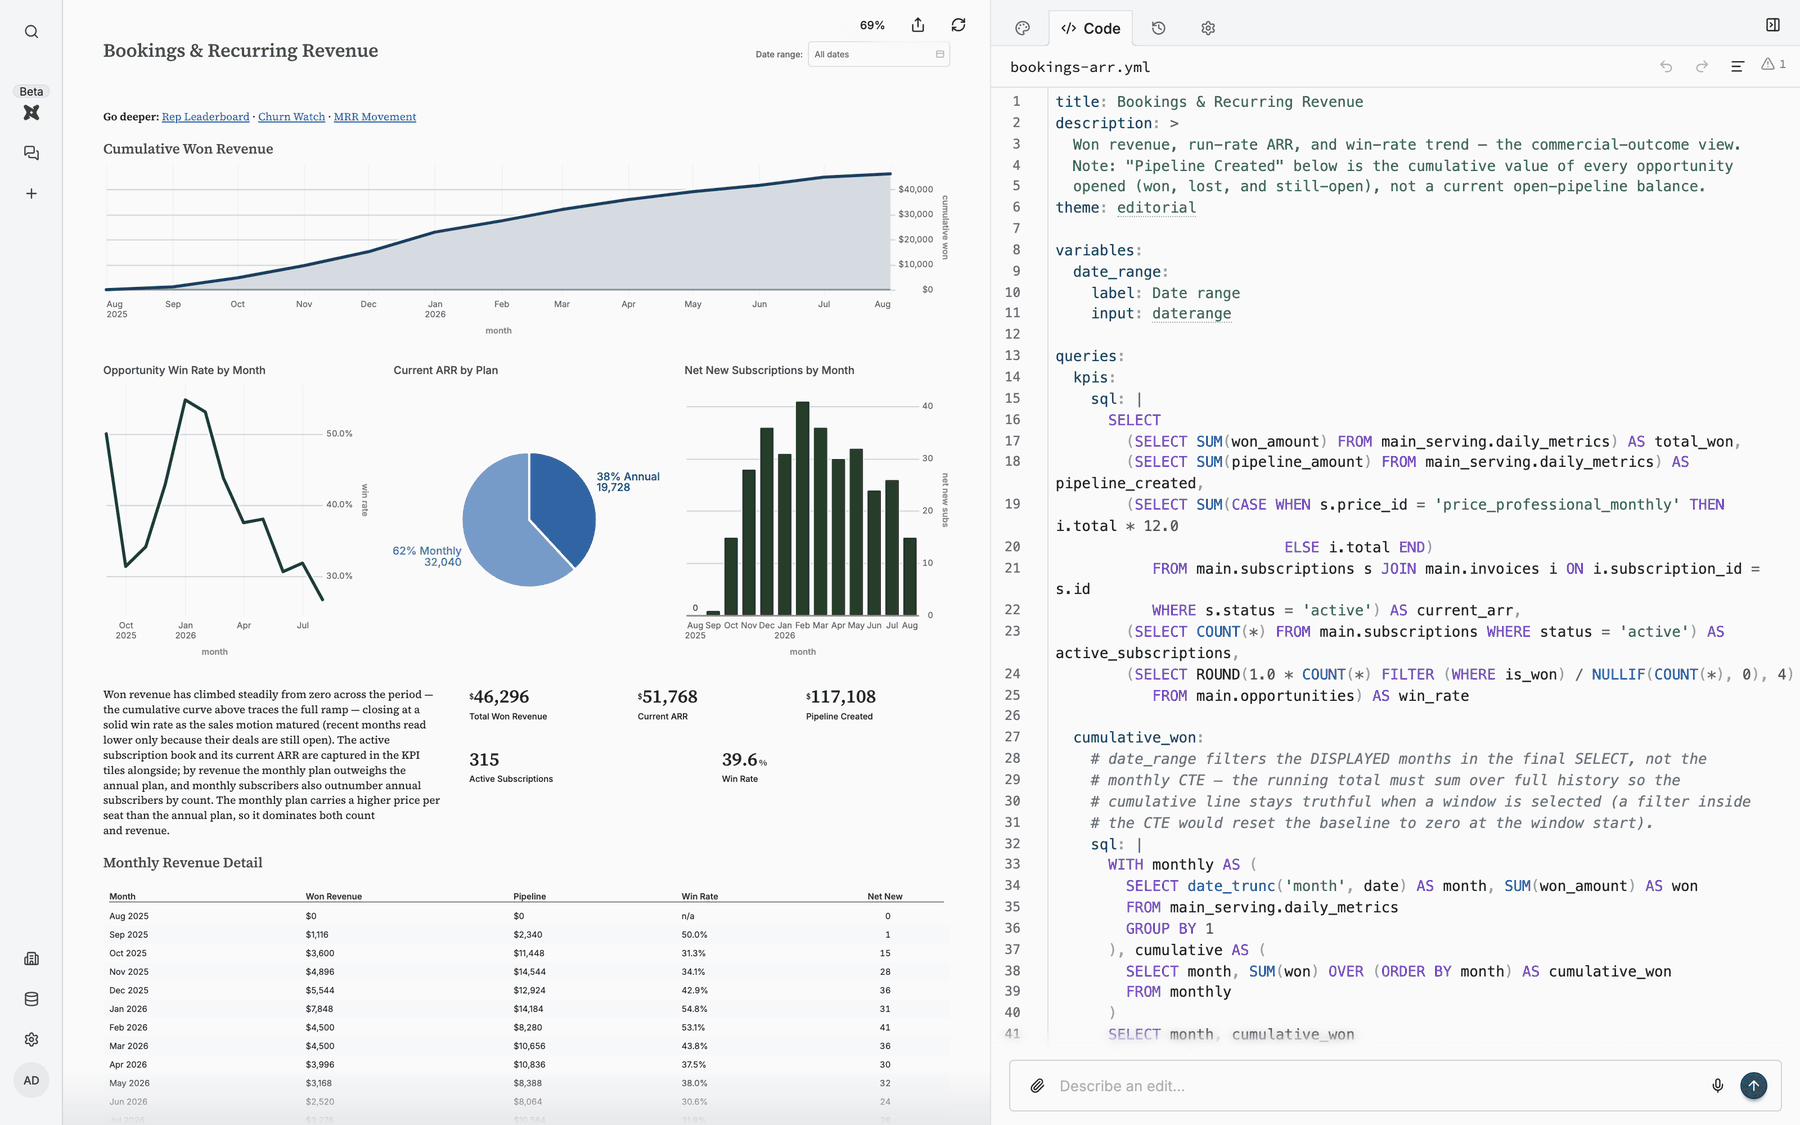
Not a transcript and not a screenshot: a real board, in the workspace, that re-renders against fresh data whenever it is opened. The agent writes the same language you do, so anything it makes you can read, edit and review.
People who only read boards get it too, scoped to the ones they can already open, so someone who cannot write a query can still ask a question about the numbers in front of them.
Underneath all of it
None of this works without the language.
The diff, the pull request, the CI check and the agent are all the same fact stated four ways: a board is a text file in an open language. That is the part we built first, and it is free.
Point it at your warehouse and ask it something.
One install at the terminal, or one sentence to Claude, Codex, or Cursor. The tool teaches the agent the rest.
uv tool install dbt-chartsMake charts of this with dbt charts. Start with: uv tool install dbt-charts && dct skills intro