AI for data is here, and the long-promised self-serve analytics is finally happening. Anyone with a data connection and Claude Code can vibe code a report in an afternoon, and the first results are genuinely impressive.
Many significant frictions still occur, however, and in our experience the good vibes don’t last. Agents on their own quickly produce massive amounts of code and artifacts that make it difficult, if not impossible, to audit. A simple static report will create multiple files of HTML, CSS and JavaScript and import a few different viz libraries. Going further and making it live or interactive creates a React and/or Streamlit stack. Tracing where a chart’s numbers came from can lead through several transformations, across multiple languages and files. Trying to keep a consistent theme, or even changing a few small things, can turn into a rewrite.
That sprawl isn’t only hard for people to audit. It slows the AI down too. Every change means re-reading all of it, and every layer is another place for a subtle mistake to hide.
Modern BI tools have bolted copilots onto their UI-first applications. That keeps the AI on governed rails, but the rails are narrow: the agent can only do what the UI exposes, without the ease and flexibility it has when it works in code.
We have seen this before
As dbt Labs founder Tristan Handy wrote recently in BI’s Second Unbundling:
When I started in data, BI tools were full-stack. Everything happened inside one product: data ingestion, transformation, compute, caching, semantics, visualization, identity. The BI tool was the data stack. MicroStrategy, Cognos, etc: they’re not just visualization tools, they’re integrated data platforms.
Then the modern data stack happened. From ~2015 to 2022, the infrastructure layers of that BI bundle got pulled out and turned into purpose-built infrastructure. Compute went to the Big 5. Ingestion went to Fivetran. Transformation went to dbt. The BI tool was left with: visualization, interactive analytical interfaces, semantic definitions (sometimes!), identity and access management, and web hosting.
Tristan Handy, BI’s Second Unbundling, The Analytics Engineering Roundup
- Warehousing Big 5
- E L T Extract Load Transform
What was left is the BI tool we know today, and the second unbundling takes the biggest piece out of it. Dashboards-as-code was right but early, because hand-writing YAML never beat a chart builder. Then the front end of everything became a coding agent. Models are excellent at code, SQL, configuration and Git; give one a dbt project and it has structure to reason about, not just a canvas to click. Once charts and their controls are files in a repo, what is left of BI is not a layer of the data stack at all. It is the same three things GitHub adds to Git: somewhere to run it, control over who sees it, and a UI for the people who would rather not write the file by hand. Hosting, access and editing. Everything else is code.
Charts join the open-source dbt project
We believe the same thing is needed for the BI space, and today we are open sourcing our second language for a second layer of the stack: Charts.
- EExtract
- LLoad
- TTransform
- CChart
In dbt Charts, SQL remains the language for declaring WHAT data you want to see, and we wrap that in a YAML syntax to declare HOW you want to see it.
We’ve spent a long time simplifying the language to core, extensible elements capable of deep expression while being intuitive to organize and read. The YAML dialect wraps not just SQL but Markdown for expressive prose and (like dbt) Jinja for variables and reusable macros.
Here’s a core example with a single variable (UI filter), query and chart.
variables:
  status:
    column: main.documents.status

queries:
  doc_growth: |
    SELECT DATE_TRUNC('month', created_at) AS month,
           SUM(COUNT(*)) OVER (ORDER BY month) AS num_docs
    FROM main.documents
    WHERE {{ filter('status', status) }}
    GROUP BY 1

charts:
  growth:
    title: Documents created, all time
    type: area
    query: doc_growth
    x: month
    y: num_docs

rows:
  - growth
These core elements run deep in config options, today with over 1,100 of them
expressing 33 common chart types.
Sixteen you name outright
with type:;
the other seventeen
(lollipops, bullets, streamgraphs, slope and bump charts, small multiples) you
compose from those same few parts. And like any good language, it can flexibly
express very complex layouts and visuals.
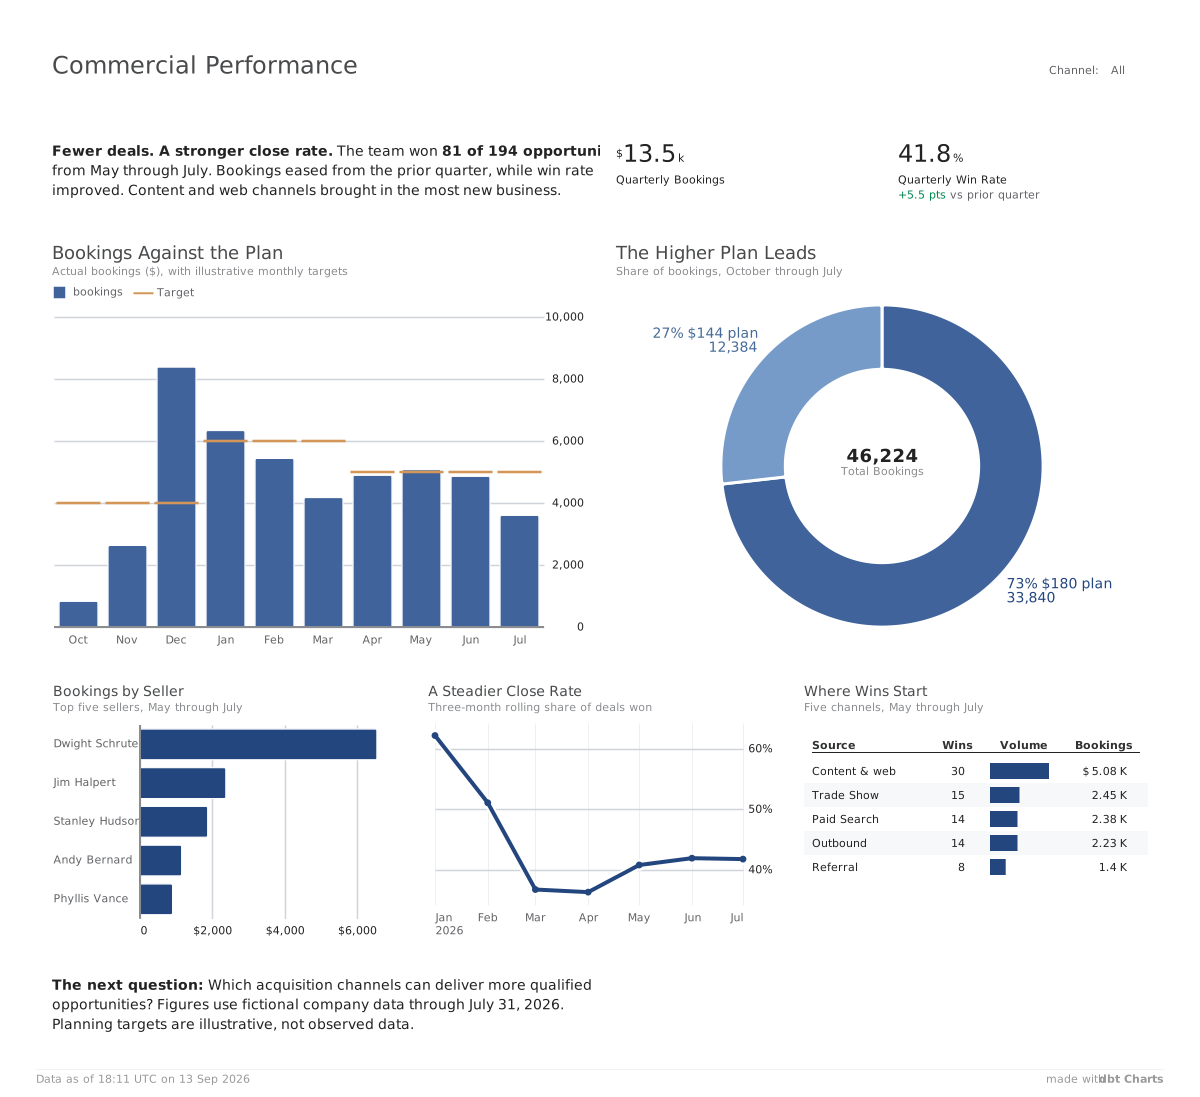
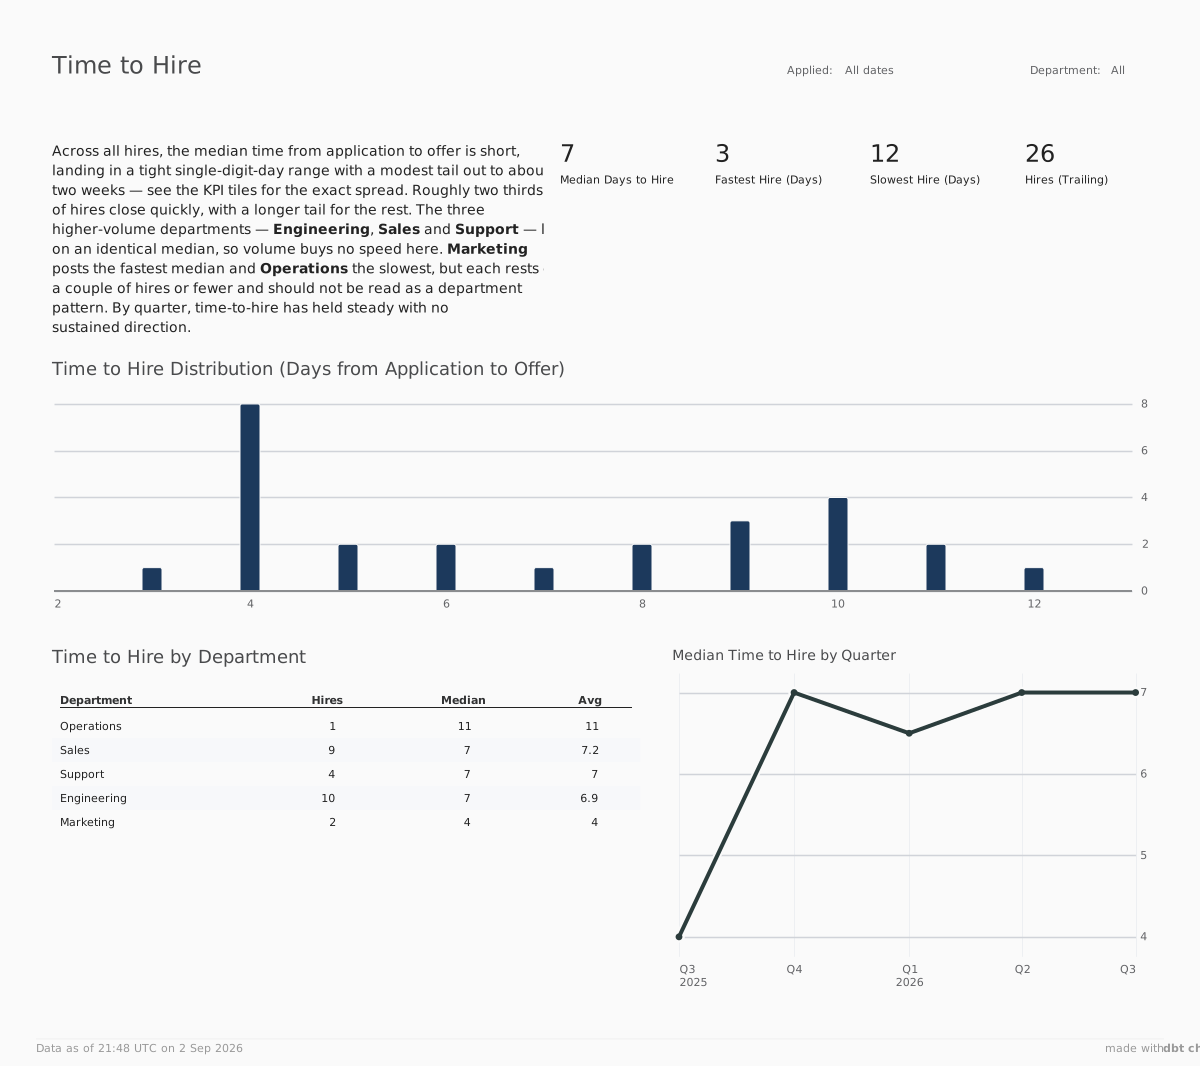
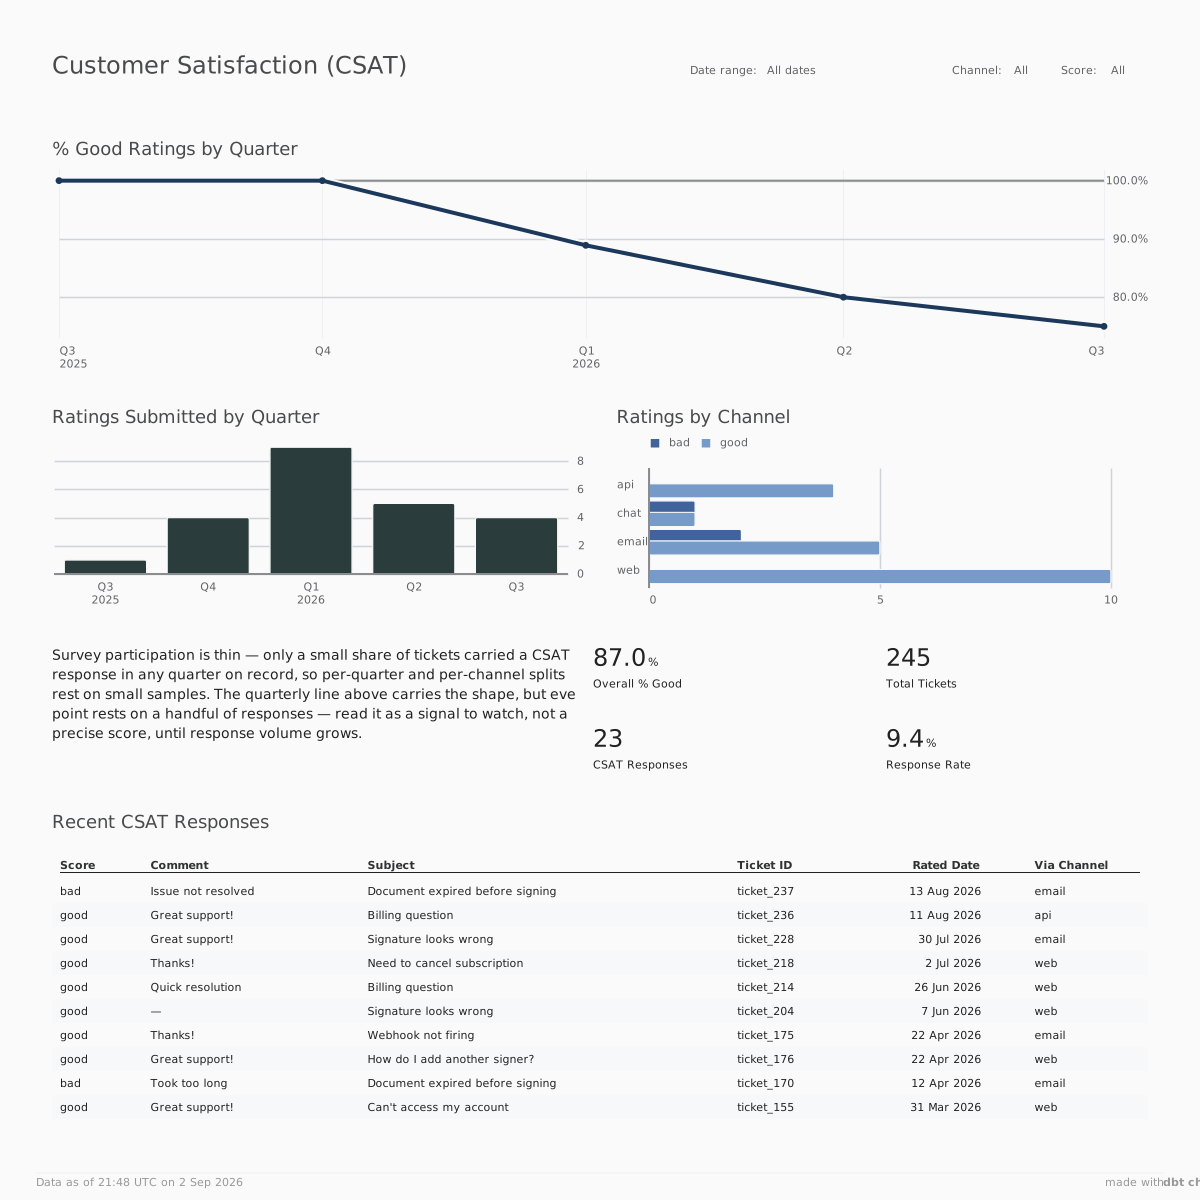
A complete dbt Charts board, rendered from one easy-to-read YAML file.
A beautiful, cohesive reporting system
We hope that dbt Charts, like dbt before it, becomes the open standard language for its layer of the data stack. We’ve designed it for a future where humans and AI work together for the most impressive results. As such, we spent a great deal of time making it look and feel like the future. We recruited RJ Andrews, an incredibly talented and passionate data graphic designer, author and historian, to make a cohesive system of charts that will truly feel on another level from your current BI products.
The spacing, sizing and layout logic of each chart has been painstakingly considered. Many tools cheat with cards or excessive boxes that feign alignment at the expense of added visual noise and lost useful space.
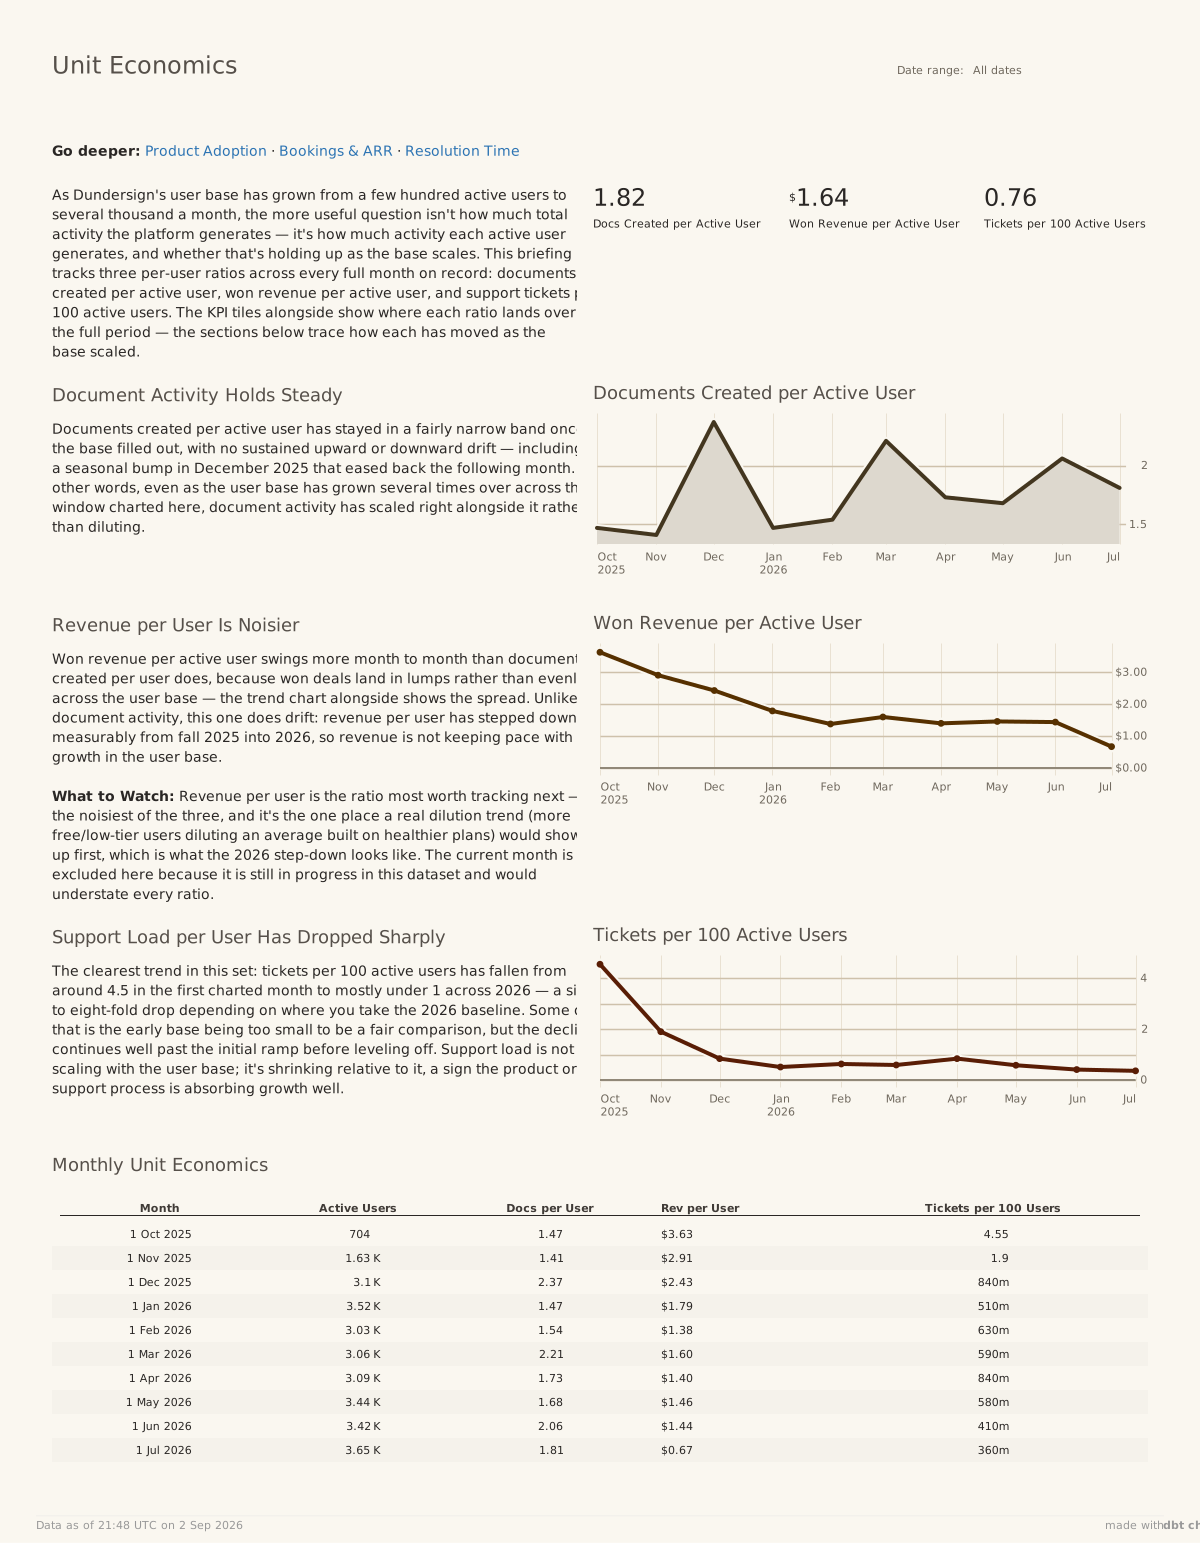
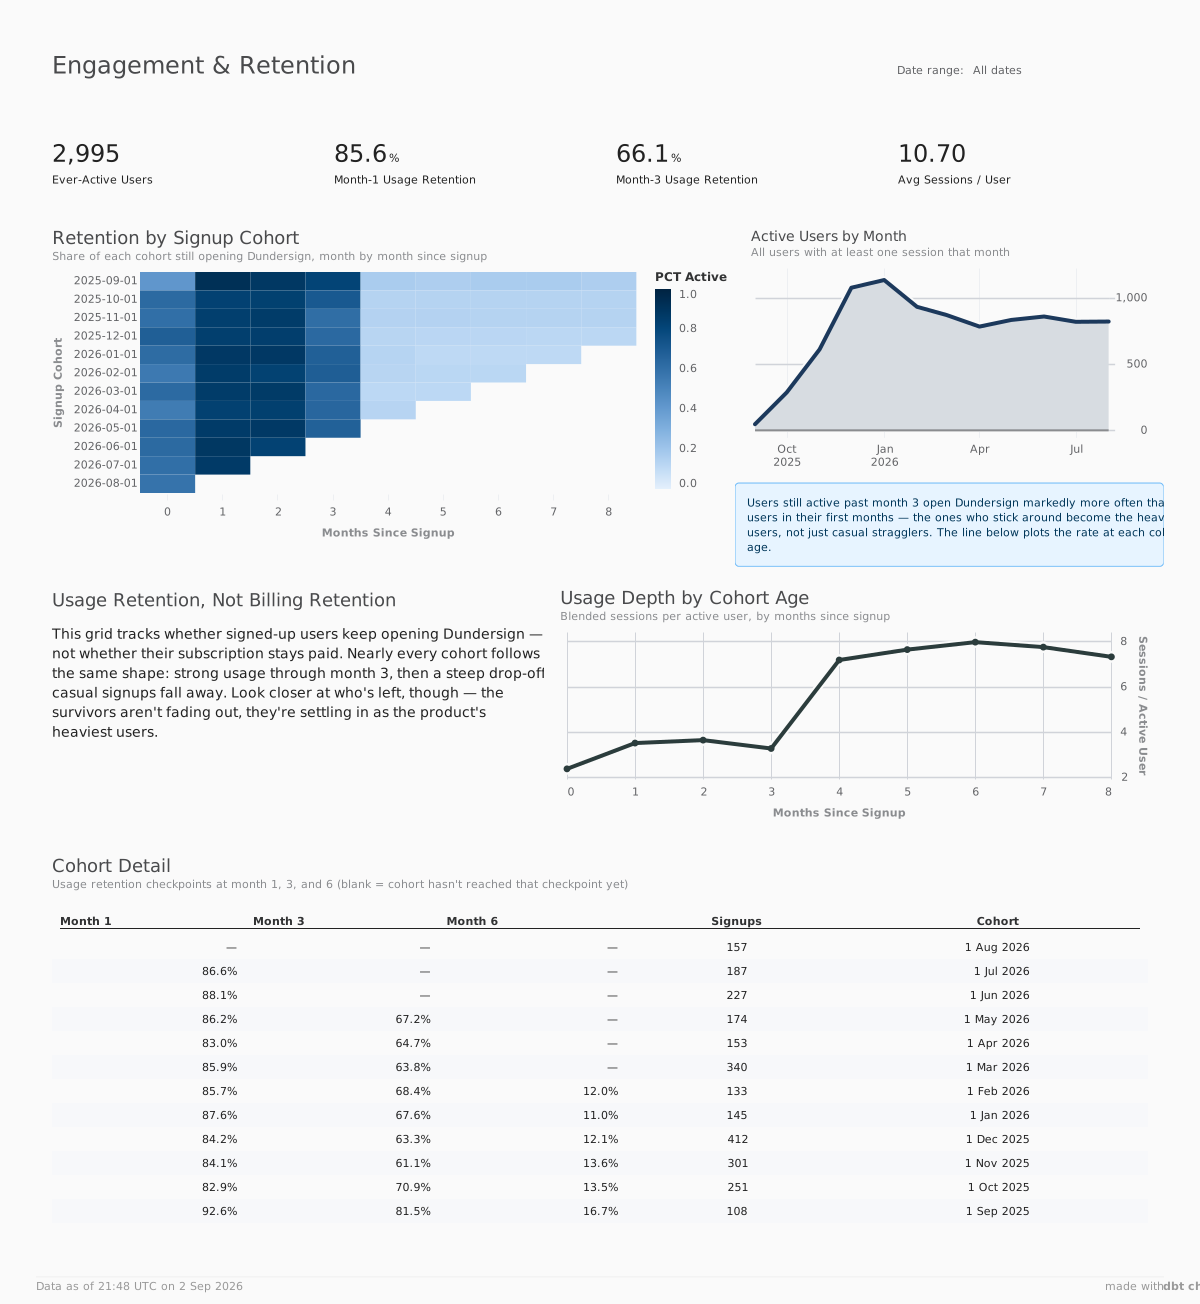
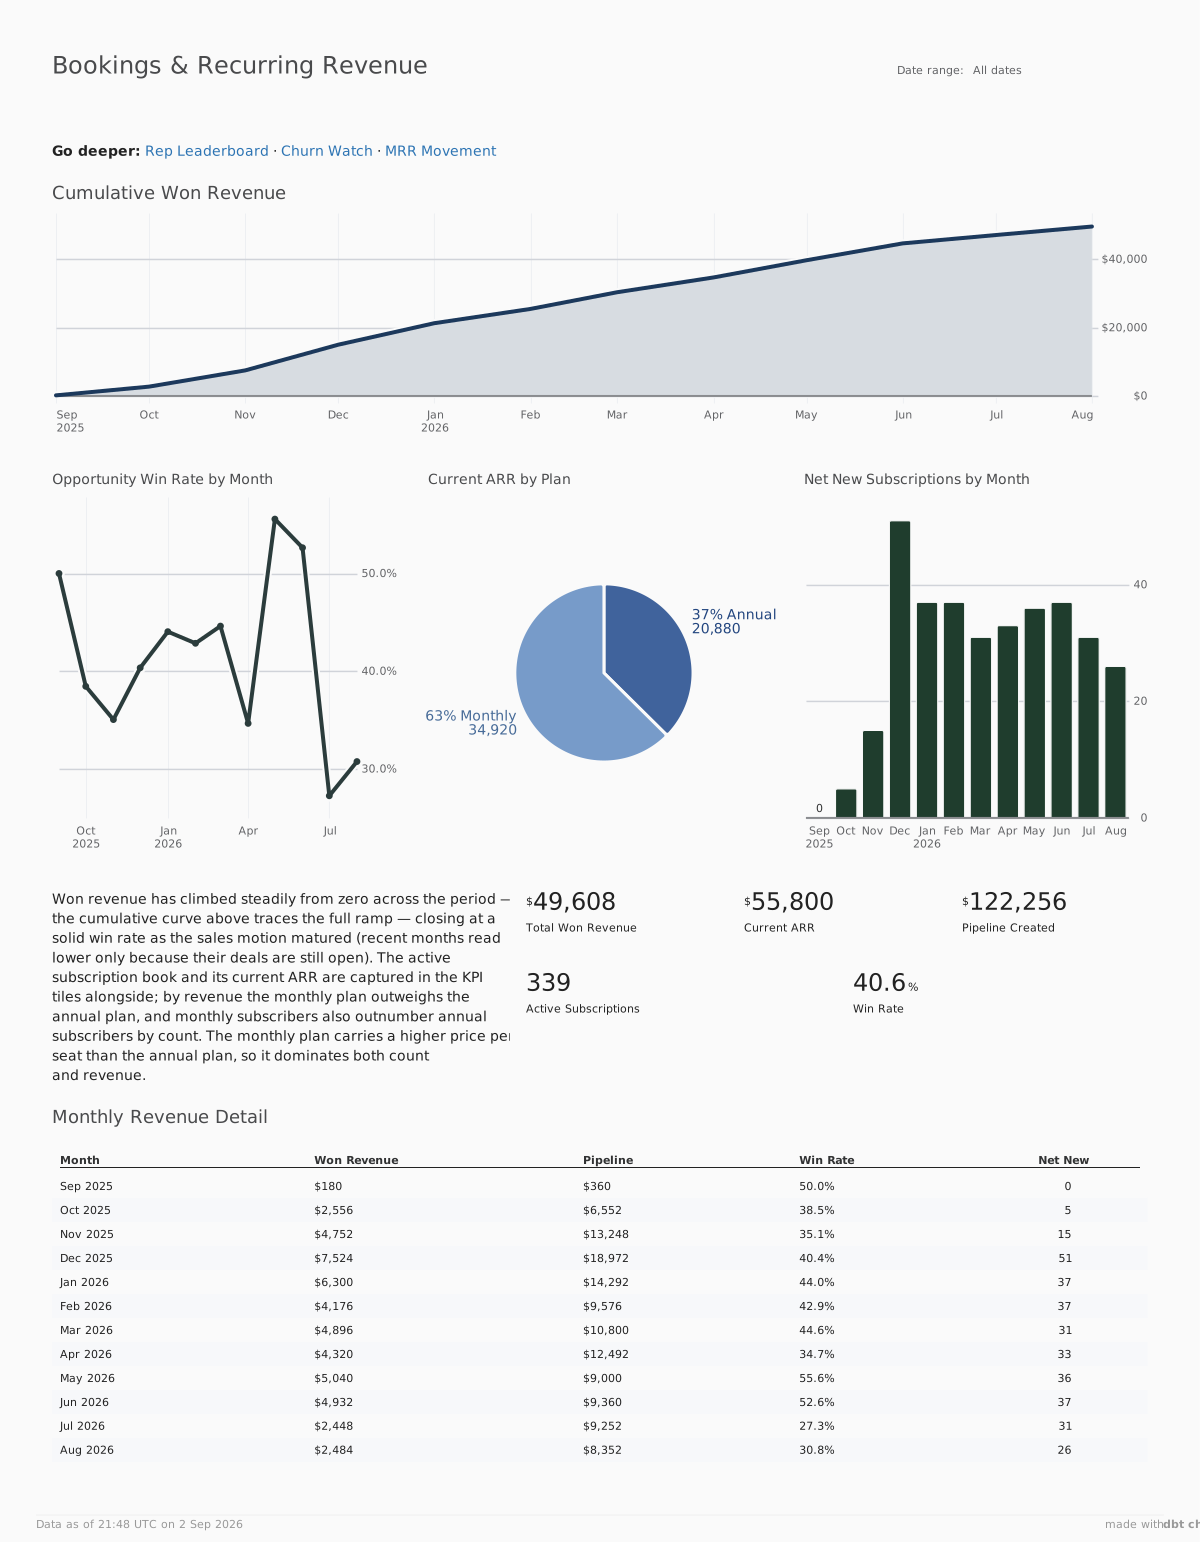
RJ has a few talks on chart design at dbt Summit in Las Vegas this week. If you’re joining us there, be sure to check them out, or follow our blog here for his coming articulations.
Deep integration with dbt
You don’t have to use dbt Charts with a dbt project, but when you do, the partnership is unlocking. The visualization layer sits right on top of the transform layer, and the deeper the integration, the easier changes to both become.
With dbt Charts, your charts/ directory lives by default right next to your
models/ in the same Git repo. This means that changes to your models or charts
can be done at the same time on the same branch and run through the same CI,
ensuring that issues come up before anything reaches production.
your_dbt_project/
  .git/
  dbt_project.yml
  models/
  charts/          # new folder in a dbt repo for your dashboards
    revenue.yml
Queries reach models through ref(), resolved from your manifest, so a renamed
model or a missing column fails the pull request that introduced the break,
before dbt run rebuilds the warehouse:
dbt parse && dct validate charts/Boundaries and feedback for agents
An agent can write a React dashboard. It can also create 182 one-pixel bars, truncate the important column, or quietly select a field that no longer exists. Generating code is not the same as producing a trustworthy result.
dbt Charts gives the agent a smaller target and a feedback loop. dct validate
checks the board’s structure, and the renderer measures the visual result and
returns coded warnings that explain what went wrong and what to change:
WARN-BAR-BAND-WIDTH-TOO-NARROW
182 bands x 2 series across 640px
Fix: roll up to a coarser grain.

WARN-TABLE-COLUMNS-OVERFLOW
Table needs 980px but only 640px is available.
Fix: drop columns or widen the slot.
That is the difference between software AI can generate and a system designed for AI: the good path is easy, likely mistakes are caught, and the model gets enough information to correct itself.
dbtcharts.com: a “BI” platform built on dbt Charts
Now that we’ve pulled the charts out of BI, there are still a few things left, namely hosting, access controls and UI. By their nature these are perhaps not unbundleable, or at least probably shouldn’t be. For them we’ve built a hosted platform on top of our open-source dbt Charts language, launching in public beta today alongside it: dbtcharts.com.
It connects to your warehouse and adds conversational analytics, a visual editor for the finishing touches, version history, and sharing with permissions for users and groups, so the people reading a board don’t need a warehouse login.
And of course, these charts were built for chat. dbtcharts.com is first-class conversational analytics: like Claude Code or ChatGPT, but with permissioned access to your data warehouse, plus expert analytics and visualization skills and tools built in. Explore by chatting with charts, and at any point click in to fine-tune and save the artifact.
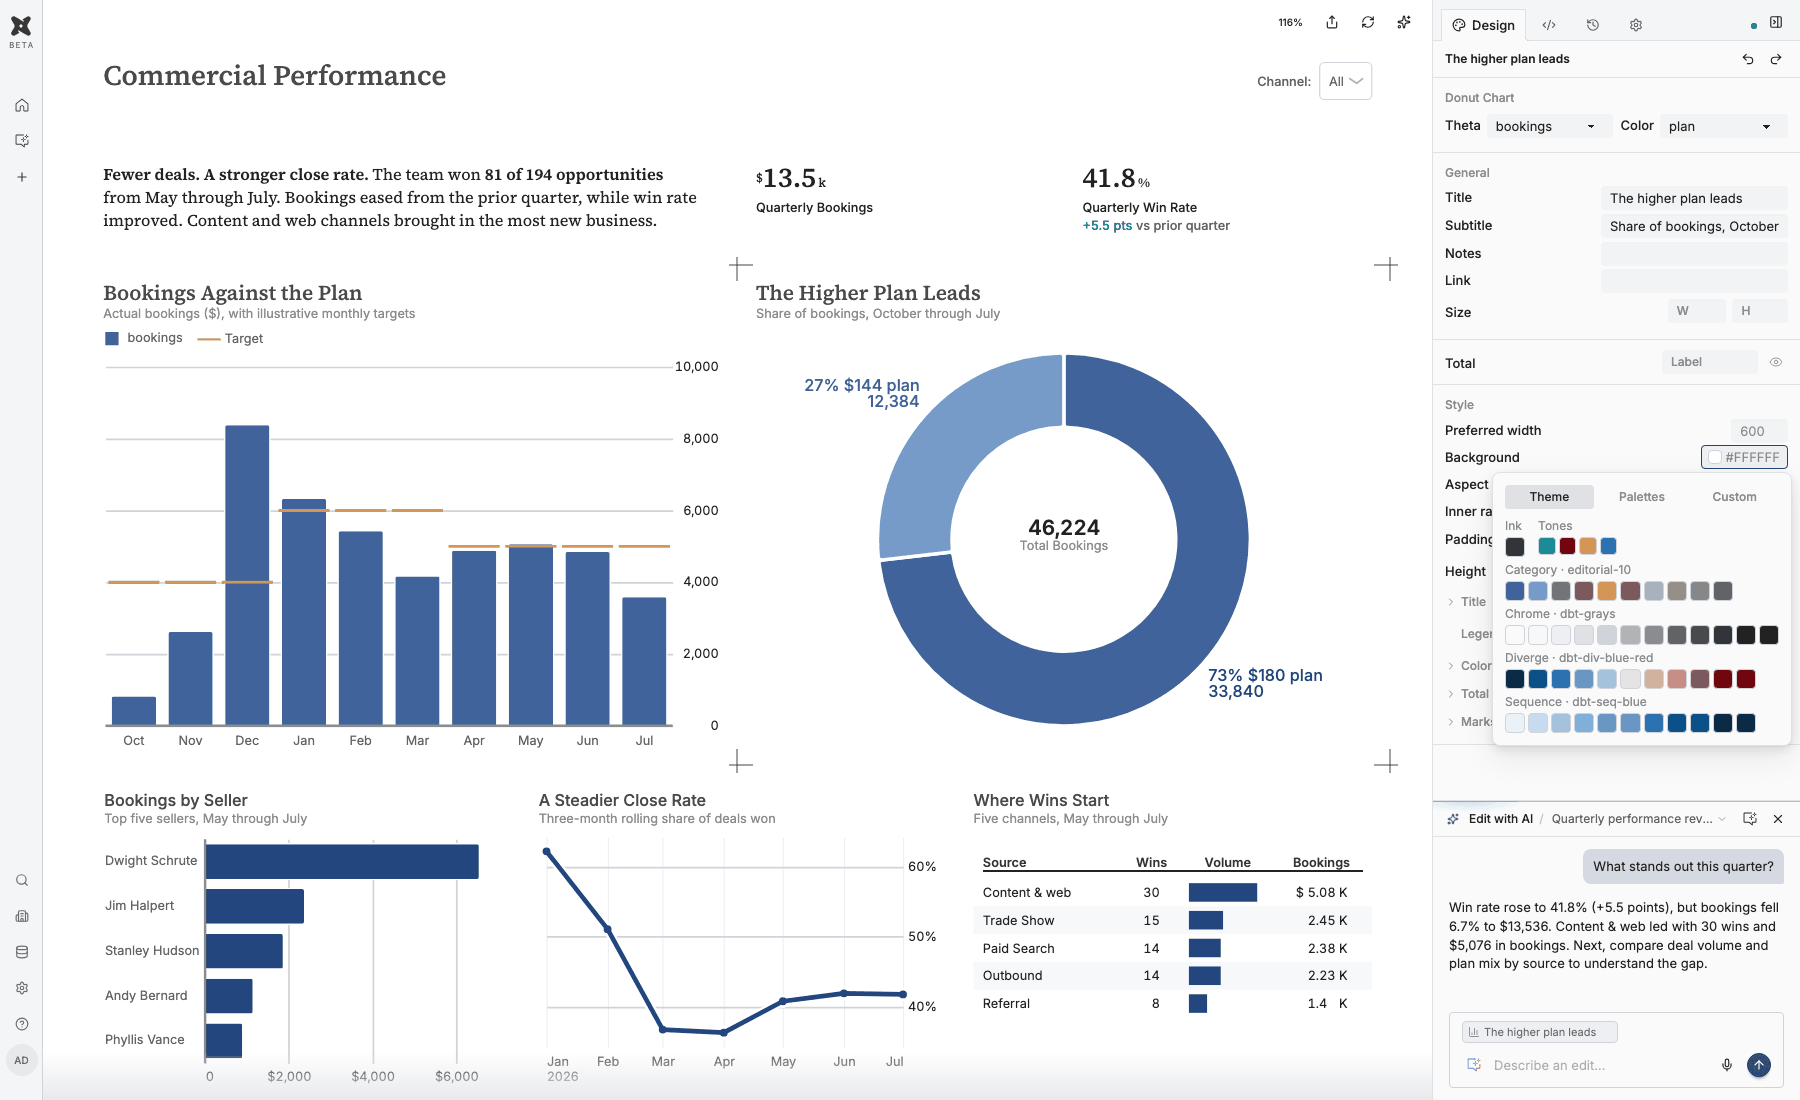
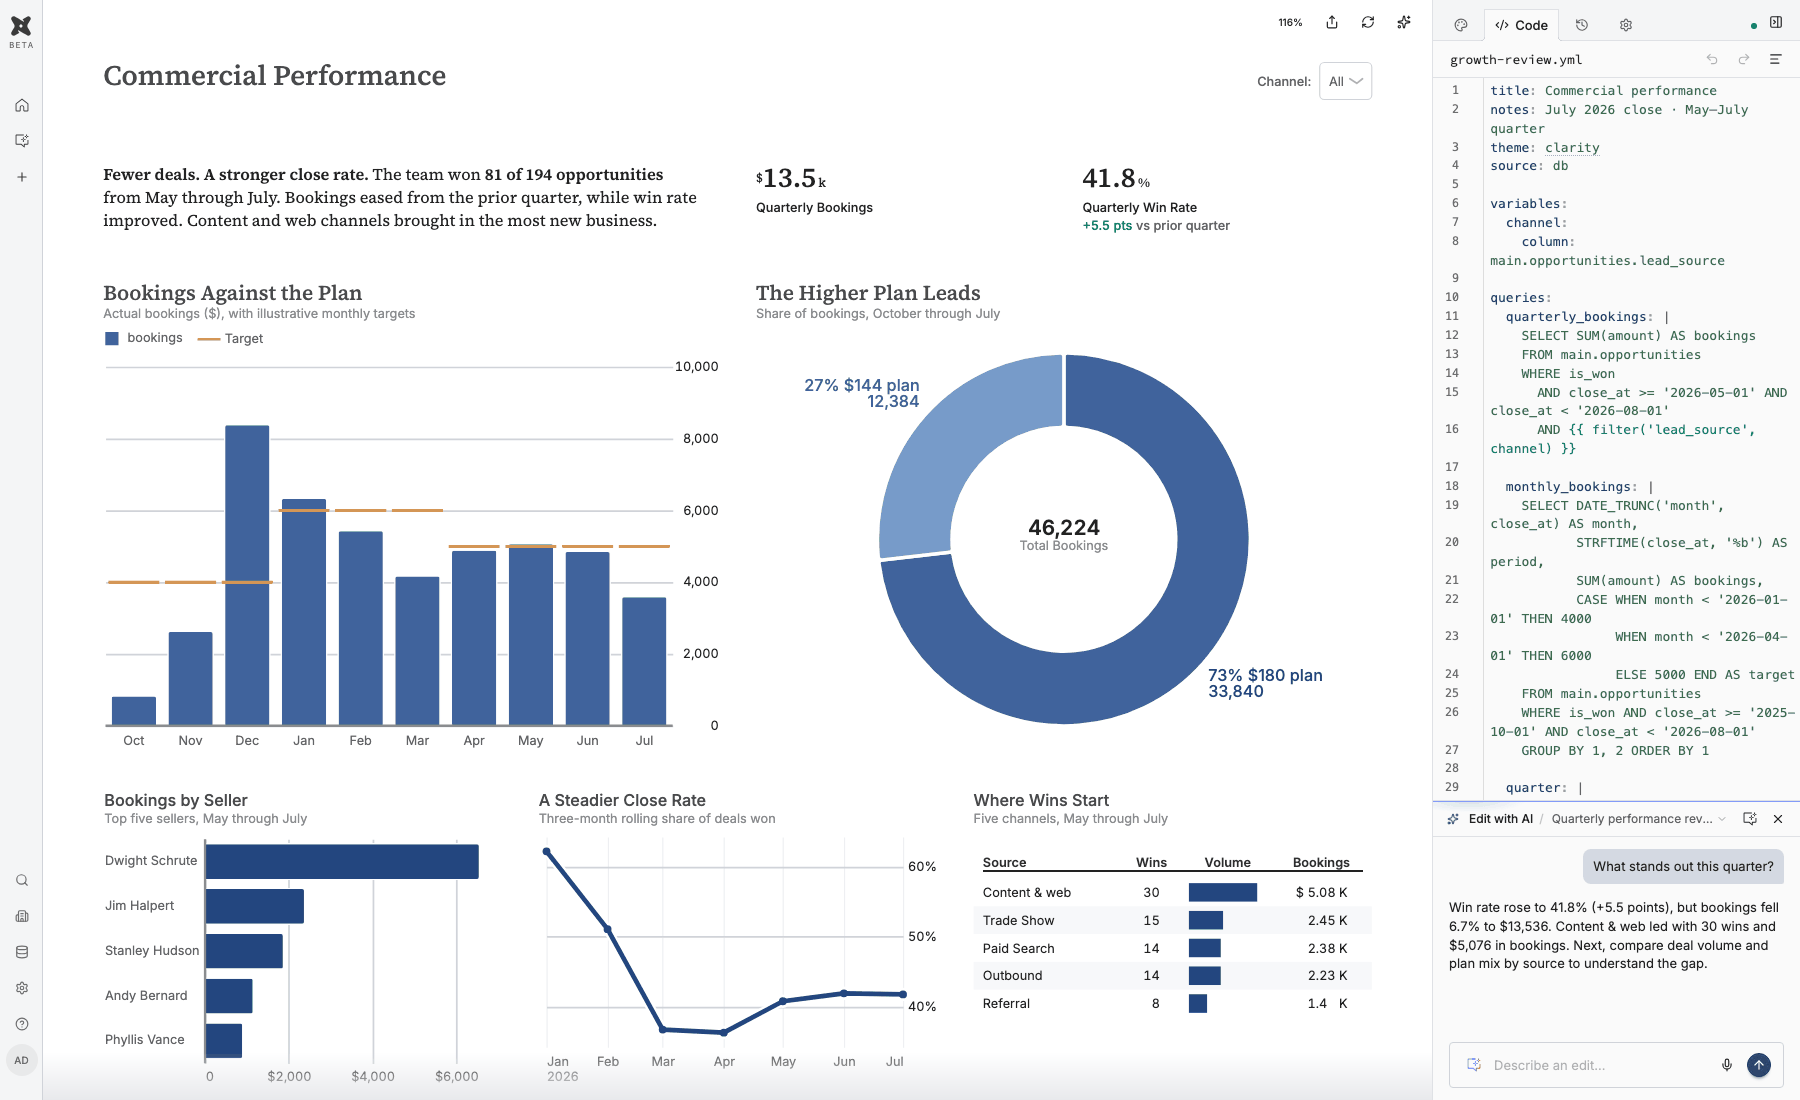
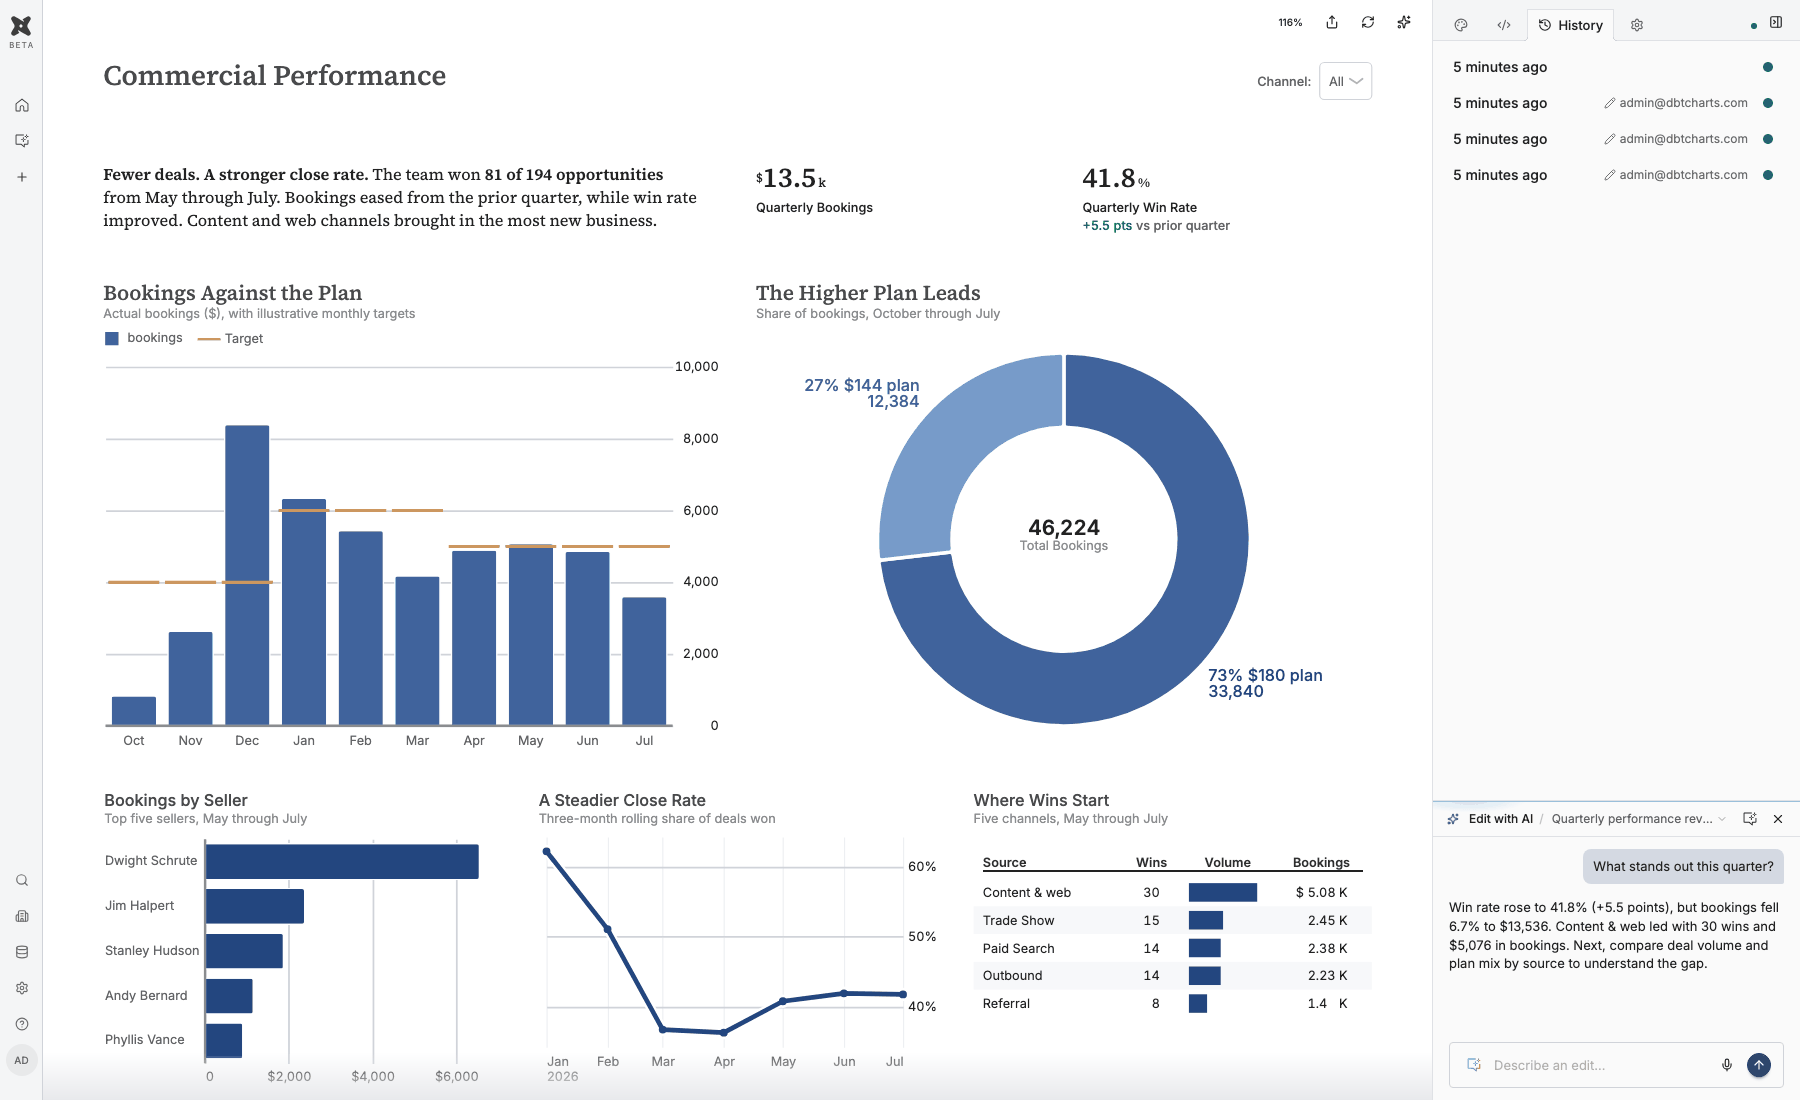
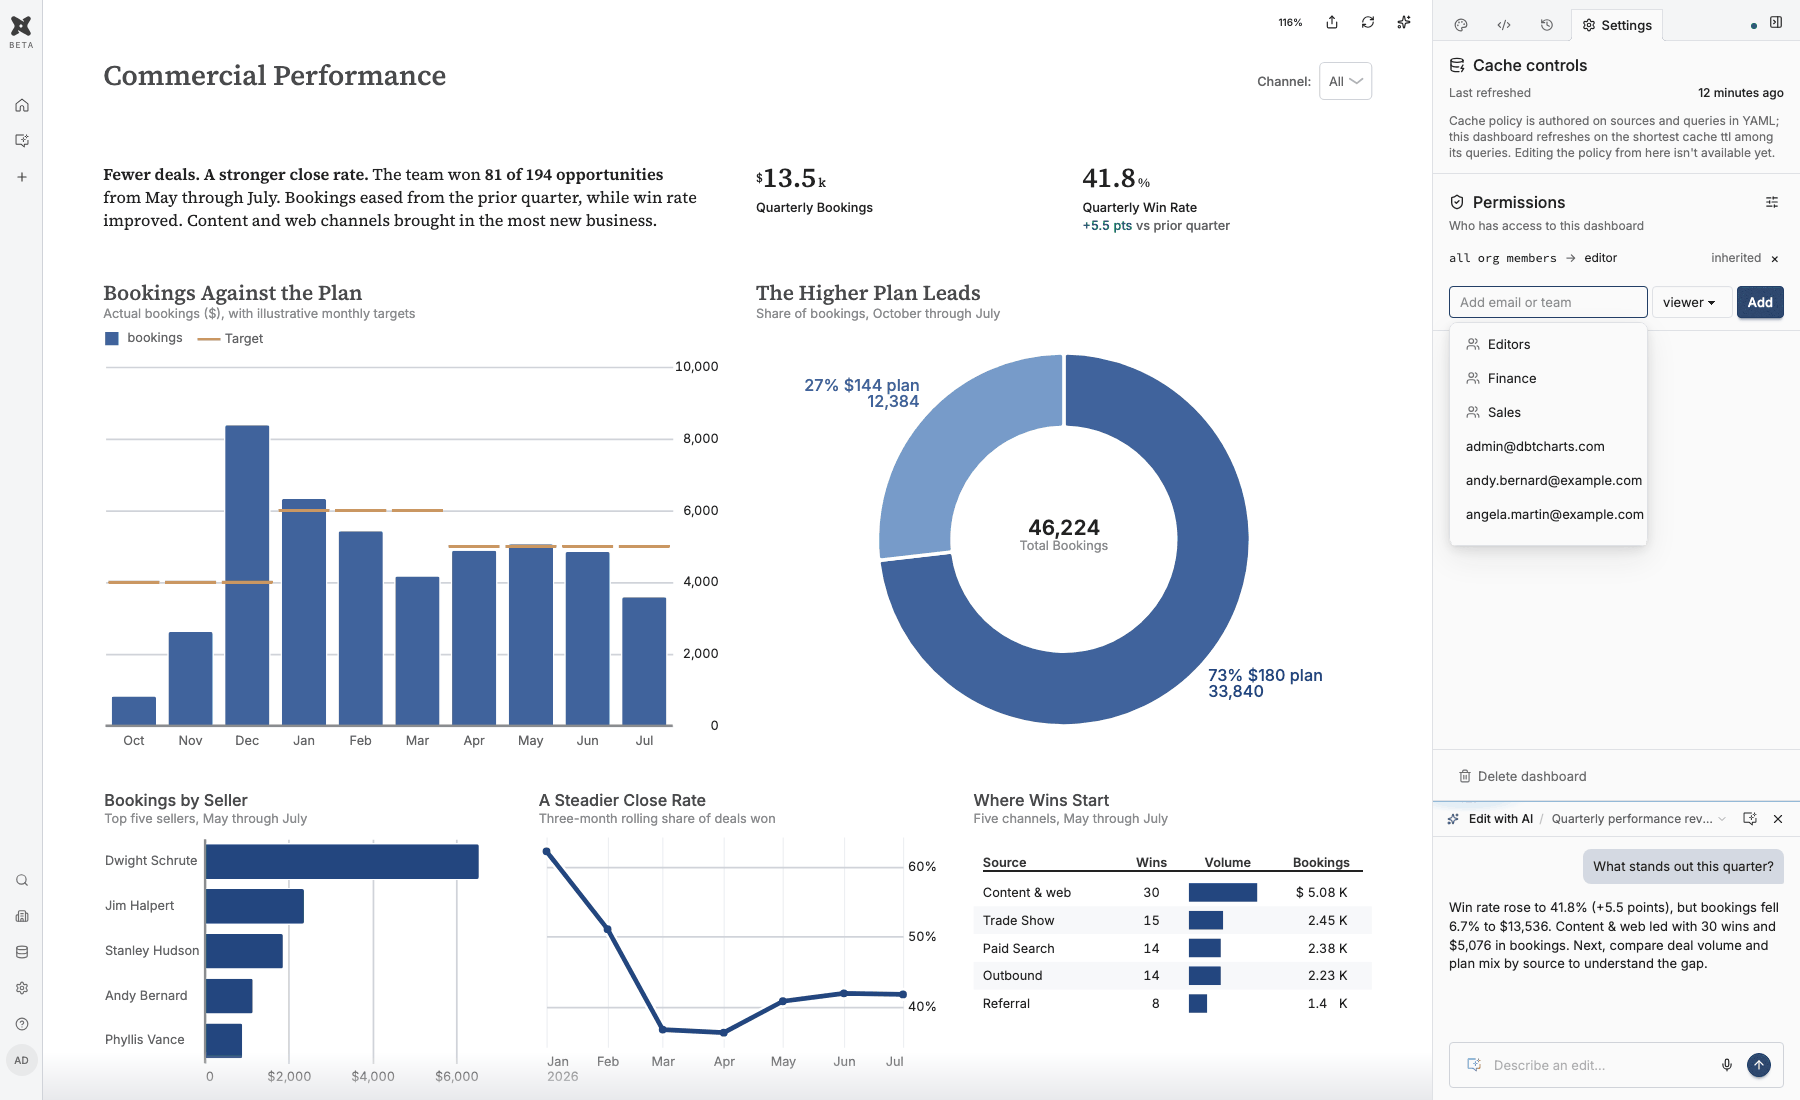
And because it’s all built on top of the open language, every change, whether it comes from chat, the visual editor or code, is written to the same YAML in your Git repo. Nothing is locked in: the same board runs on your laptop, in CI and on the platform, and teams can self-serve and vibe code the information they need without creating a second, hidden data stack.
Try the beta
The dbt Charts language is open source under the Apache 2.0 license, and you can author, render and serve boards locally without creating an account. Install it yourself, or hand your coding agent one line:
uv tool install dbt-charts
Make charts of this with dbt Charts. Start with: uv tool install dbt-charts && dct skills intro
- Code: github.com/dbt-labs/dbt-charts
- Docs: docs.dbtcharts.com
- Hosted BI: dbtcharts.com
dbt Charts is pre-1.0 and still changing. When the grammar changes, existing boards are migrated as they are parsed, so the boards you write today keep rendering. Try it, tell us what is missing, and help us build the chart layer that open data infrastructure has been waiting for.