A charts code fence in a Markdown file now builds as a chart. That works
in dct (the open-source dbt Charts command-line tool) and on dbtCharts.com,
in MkDocs and Pelican with one line of config, and in Hugo, Jekyll, Astro,
Docusaurus and GitHub READMEs through a render step that writes SVG files.
It works like any other code fence. Mermaid made a mermaid fence the usual way
to draw a diagram in Markdown; a charts fence does the same for charts, in the
simple declarative YAML a dbt Charts board is written in.
We started dbt Charts on one idea: dashboards need a Markdown, a file you can read raw, review in a diff, and that an agent writes in one pass. A board is that file. dbt Charts 0.11.1 goes the other direction. Markdown is already where people write (READMEs, docs sites, blogs, notes), and until now a chart in one meant a screenshot that went stale the next day, or an iframe into a BI tool. Now it’s a code fence:
Revenue kept climbing through the spring, led by the West.

```charts
type: bar
title: Revenue by month
query:
  columns: [month, region, revenue]
  values:
    - [Jan, West, 120]
    - [Feb, West, 150]
    - [Mar, West, 210]
    - [Jan, East, 90]
    - [Feb, East, 110]
    - [Mar, East, 130]
x: month
y: revenue
color: region
```

That's the whole page.
Build the page and the fence becomes this chart, in its place in the prose:
Anywhere that doesn’t know dbt Charts, the fence is still a readable block of YAML. That’s the deal Markdown made: the source is nearly the document.
Every surface runs the same engine
In dct and on dbtCharts.com a Markdown note was already a board, prose and
charts together. Now dct render notes/post.md works on any file you name that
holds a fence.
MkDocs and Pelican run on Python-Markdown, so there it’s one line of config:
markdown_extensions:
  - dbt_charts.integrations.markdown
Hugo, Jekyll, Astro and Docusaurus don’t run Python, and neither does GitHub, so for those you render the page first:
dct render post.md --format md
It compiles every fence and runs its query ahead of time, then writes the page with each fence swapped for an image link and the SVG files beside it. What ships is static files: no query runs when someone reads the page. GitHub strips SVG written inline into a README but shows an SVG image file, so a README can carry a chart that CI redraws from the data on every merge.
We didn’t write a second, lighter renderer for the browser. All of these run the same engine, so a chart looks the same in a dbtCharts.com note, on your docs site and in your README.
A page is one board
A fence holds what one item of a board’s rows: holds: a chart, a whole board,
the name of a chart, or the path of another board file or page. Query and chart names are shared across the page, so a
query you declare in one fence can feed a chart three paragraphs down:
```charts
queries:
  sales:
    sql: select month, region, revenue from monthly_revenue
charts:
  by_month:
    type: bar
    query: sales
    x: month
    y: revenue
rows:
  - by_month
```

The same numbers as a trend:

```charts
type: line
query: sales
x: month
y: revenue
```
That’s how dct reads a Markdown board, so a page you write for your docs site
renders the same on dbtCharts.com. Each fence still draws as its own chart,
where you put it.
Show the code
Our docs put the YAML beside the chart it draws, with a button that opens it in
the Playground. That layout is a fence too, charts-example:
```charts-example
title: Revenue by region
charts:
  by_region:
    type: bar
    query:
      columns: [region, revenue]
      values:
        - [West, 480]
        - [East, 330]
    x: region
    y: revenue
rows:
  - by_region
```
It draws the YAML beside its chart:
title: Revenue by region
charts:
  by_region:
    type: bar
    query:
      columns: [region, revenue]
      values:
        - [West, 480]
        - [East, 330]
    x: region
    y: revenue
rows:
  - by_region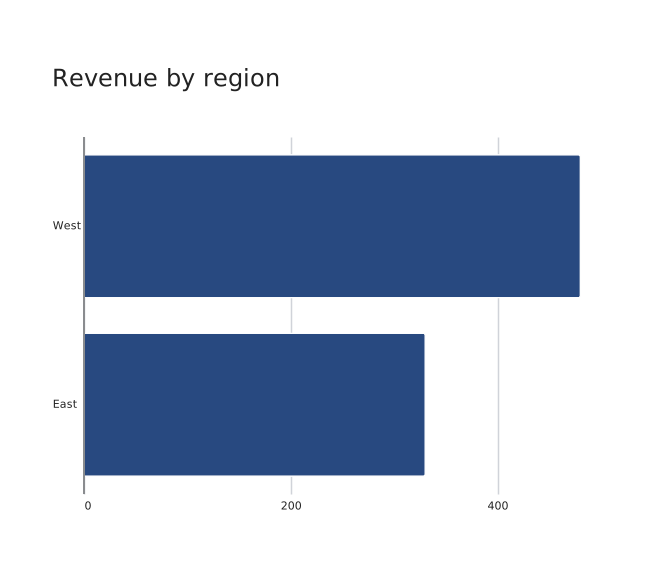
An option after the fence’s name changes the layout: ```charts-example {format=stacked}
puts the YAML above the chart, {format=render-only} shows only the chart, and
{format=yaml-only} only the code. Every chart on the page then shows how it was
made.
Charts draw when the site builds
Inline values need no project or credentials; a warehouse query runs at build
time with the same credentials dct uses, and a fence that doesn’t render stops
the build at its line. Themes and style work as in any dbt Charts project (see
Themes).
Hover works too
The charts a fence draws are inline SVG, so hover tooltips and emphasis work on your own site: the MkDocs and Pelican extension adds one small script to each page that has a chart, and it serves every chart on the page, themed differently or added after load.
markdown_extensions:
  - dbt_charts.integrations.markdown:
      include_runtime: true
A site that serves the script itself turns that off and loads the file from
dct runtime-js --out charts.js. An SVG shown through an image tag, which is
what the render step writes for a README, can’t run scripts, so it stays still.
Try it
pip install dbt-charts mkdocsAdd dbt_charts.integrations.markdown to mkdocs.yml, write a fence, and run
mkdocs serve. For any other site generator, run dct render --format md
before the build. The setup for each is in the docs:
MkDocs and Pelican and
Static sites.
Charts in Markdown in charts in Markdown in …
A fence can place a board, a board can place a Markdown page, and that page can have fences of its own. So, one last figure, which explains itself:
See the Markdowna example
<!-- charts-in-markdown-doll.md -->
I'm a Markdown document. The fence below holds a dbt Charts board.

```charts
style:
  background: "#f4efe4"
  padding: "16px"
  border:
    radius: 8
text: |
  And I'm that board. I can hold Markdown too. See my bullets?

  - a chart, like the one under me
  - a whole page, like the one under that
charts:
  depth:
    type: bar
    title: How deep this goes
    query:
      columns: [level, depth]
      values:
        - [the document, 1]
        - [a board, 2]
        - [a page, 3]
        - [a board again, 4]
    x: level
    y: depth
rows:
  - depth
  - ./charts-in-markdown-doll-page.md
```
<!-- charts-in-markdown-doll-page.md -->
---
board:
  style:
    background: "#e9eff6"
    padding: "16px"
    border:
      radius: 8
---
And I'm a Markdown page inside that board, with a fence of my own:

```charts
style:
  background: "#f4efe4"
  padding: "16px"
  border:
    radius: 8
text: |
  And me? I'm a board, in a page, in a board, in a document. I could hold
  more Markdown and charts, and so on, all the way down.
charts:
  levels:
    type: kpi
    label: Levels so far
    query:
      columns: [levels]
      values:
        - [4]
    value: levels
rows:
  - levels
```
None of the prose in that figure is HTML: dbt Charts draws it with its own Markdown renderer, into the same SVG as the charts. We’re our own first customer.
To be clear, this is a silly example: boards already nest inside boards, so real recursion doesn’t need a trip through a Markdown fence. We were just showing off.