dbt Charts 0.11.1 completes our move off Vega-Lite for chart rendering. Every chart type, maps included, now draws directly through our own Rust renderer. With that foundation in place, we’re moving beyond Vega-Lite and building more of the chart behavior and design we want directly into dbt Charts.
This release adds annotations, series isolation and hover emphasis, table sorting and filtering, and import tools for Looker, Sigma, Hex and Omni. It also brings faster rendering and more control over reporting calendars.
We think we’re getting close to calling dbt Charts 1.0.0. We’re still in beta, and we haven’t set a date, but completing the renderer is a substantial step toward that release. Here’s what’s new.
Our own renderer, for every chart
This is also the first release in which every chart type draws through our own Rust renderer. Maps complete the move away from Vega-Lite: we now draw every chart directly as SVG rather than translating it into a Vega-Lite specification.
Owning the renderer gives us direct control over how charts are drawn, from label placement to annotations and pattern fills. This release also brings faster rendering for bar, line, area, scatter, histogram, heatmap and map charts. Your boards keep the same YAML authoring language.
Follow a series
The examples below use invented data.
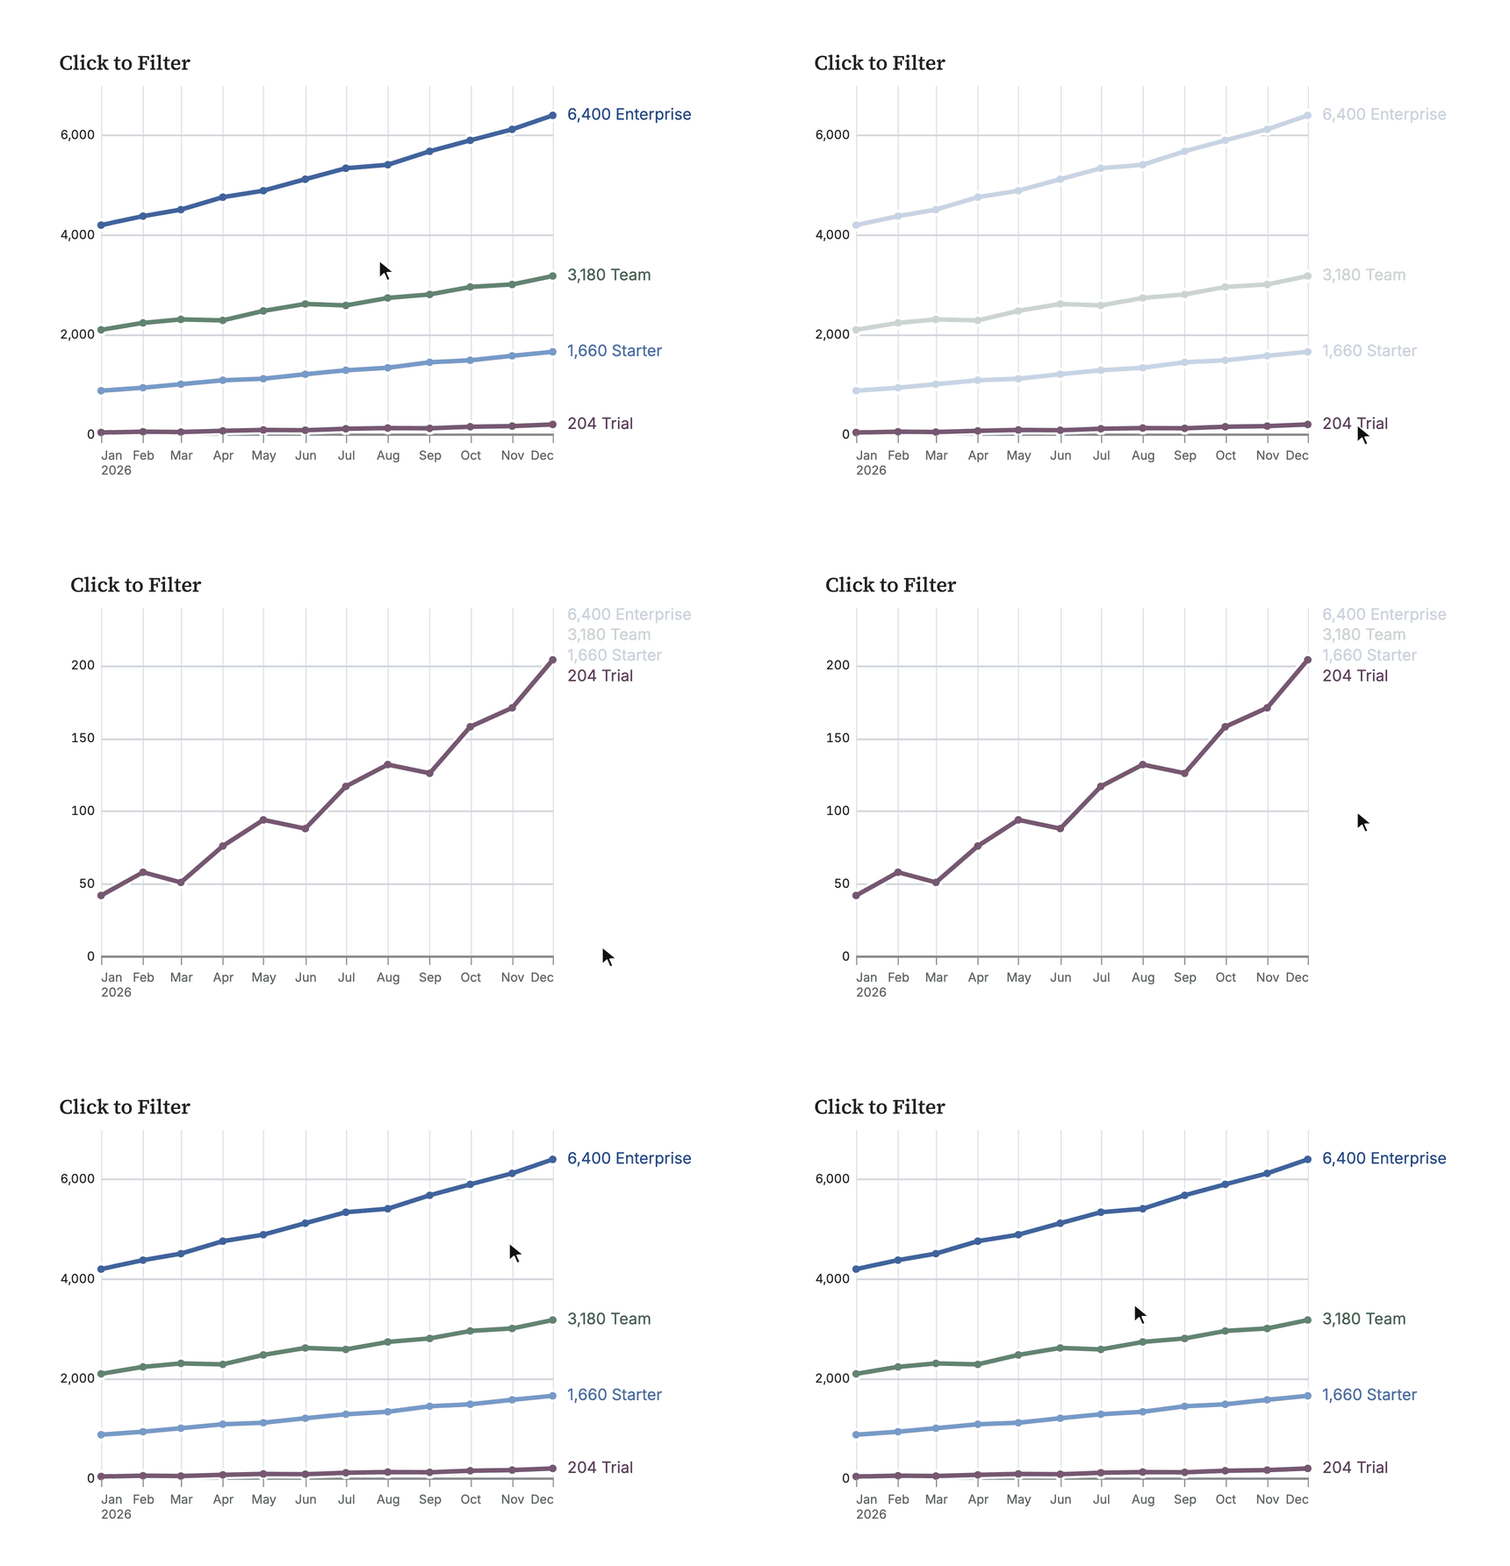
Hover over a legend entry or a series name and that series stands out. Click it to show only that series, with the value axis fitted to it. Each further click adds or removes a series from the selection, so you can choose the comparison you want to make.
The same emphasis helps with stacked bars. Here, hovering over a category brings out its contribution across the year while the other categories recede.
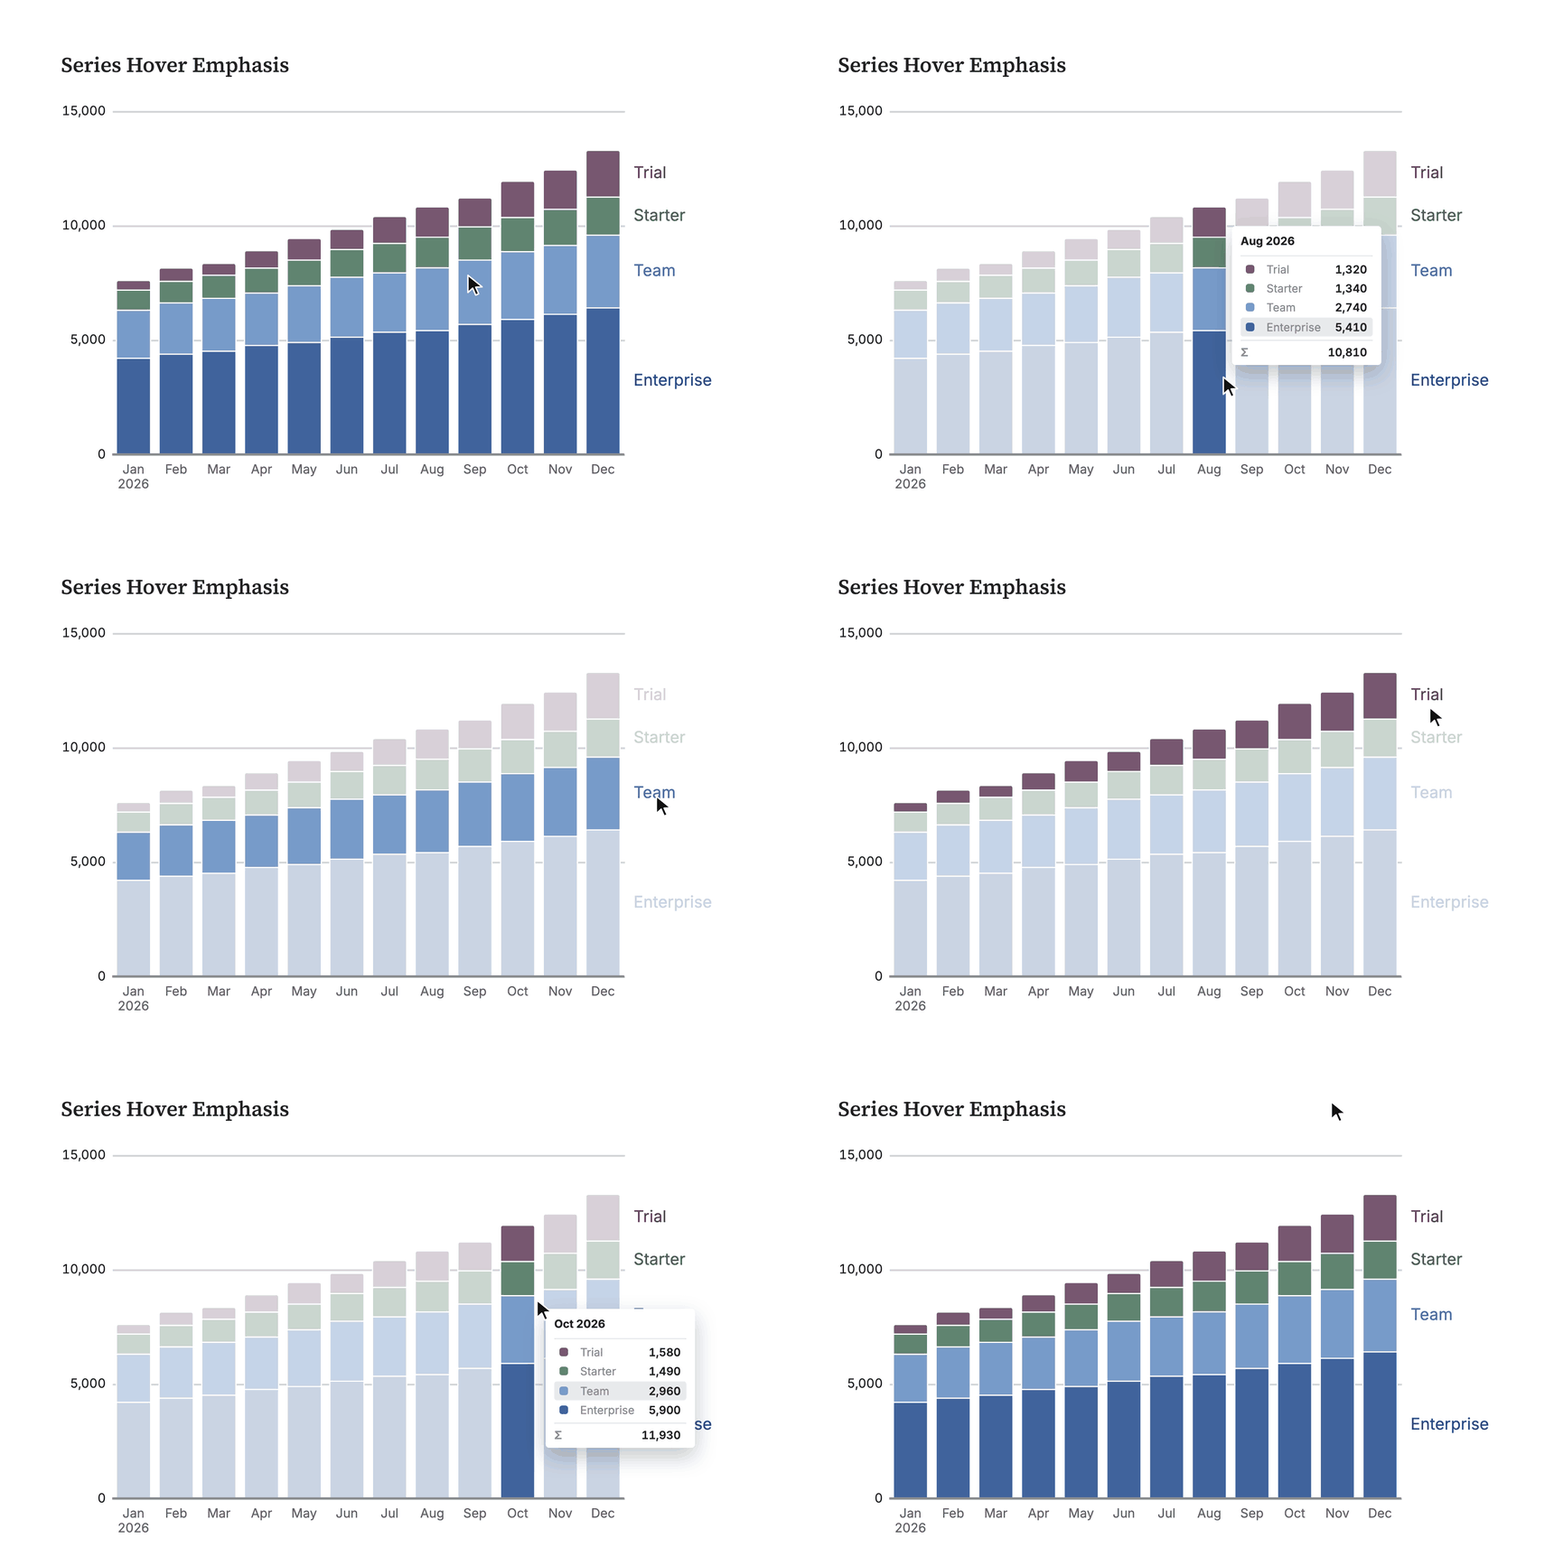
A chart’s hover card can also show more than its plotted values. Choose extra
query columns with tooltip: to put the supporting detail within reach
without adding more marks to the plot.
Annotations
The line below rises above staffing capacity during a product launch. A rule marks capacity, a shaded band marks the launch window, and a note points to the peak. The explanation stays with the numbers.
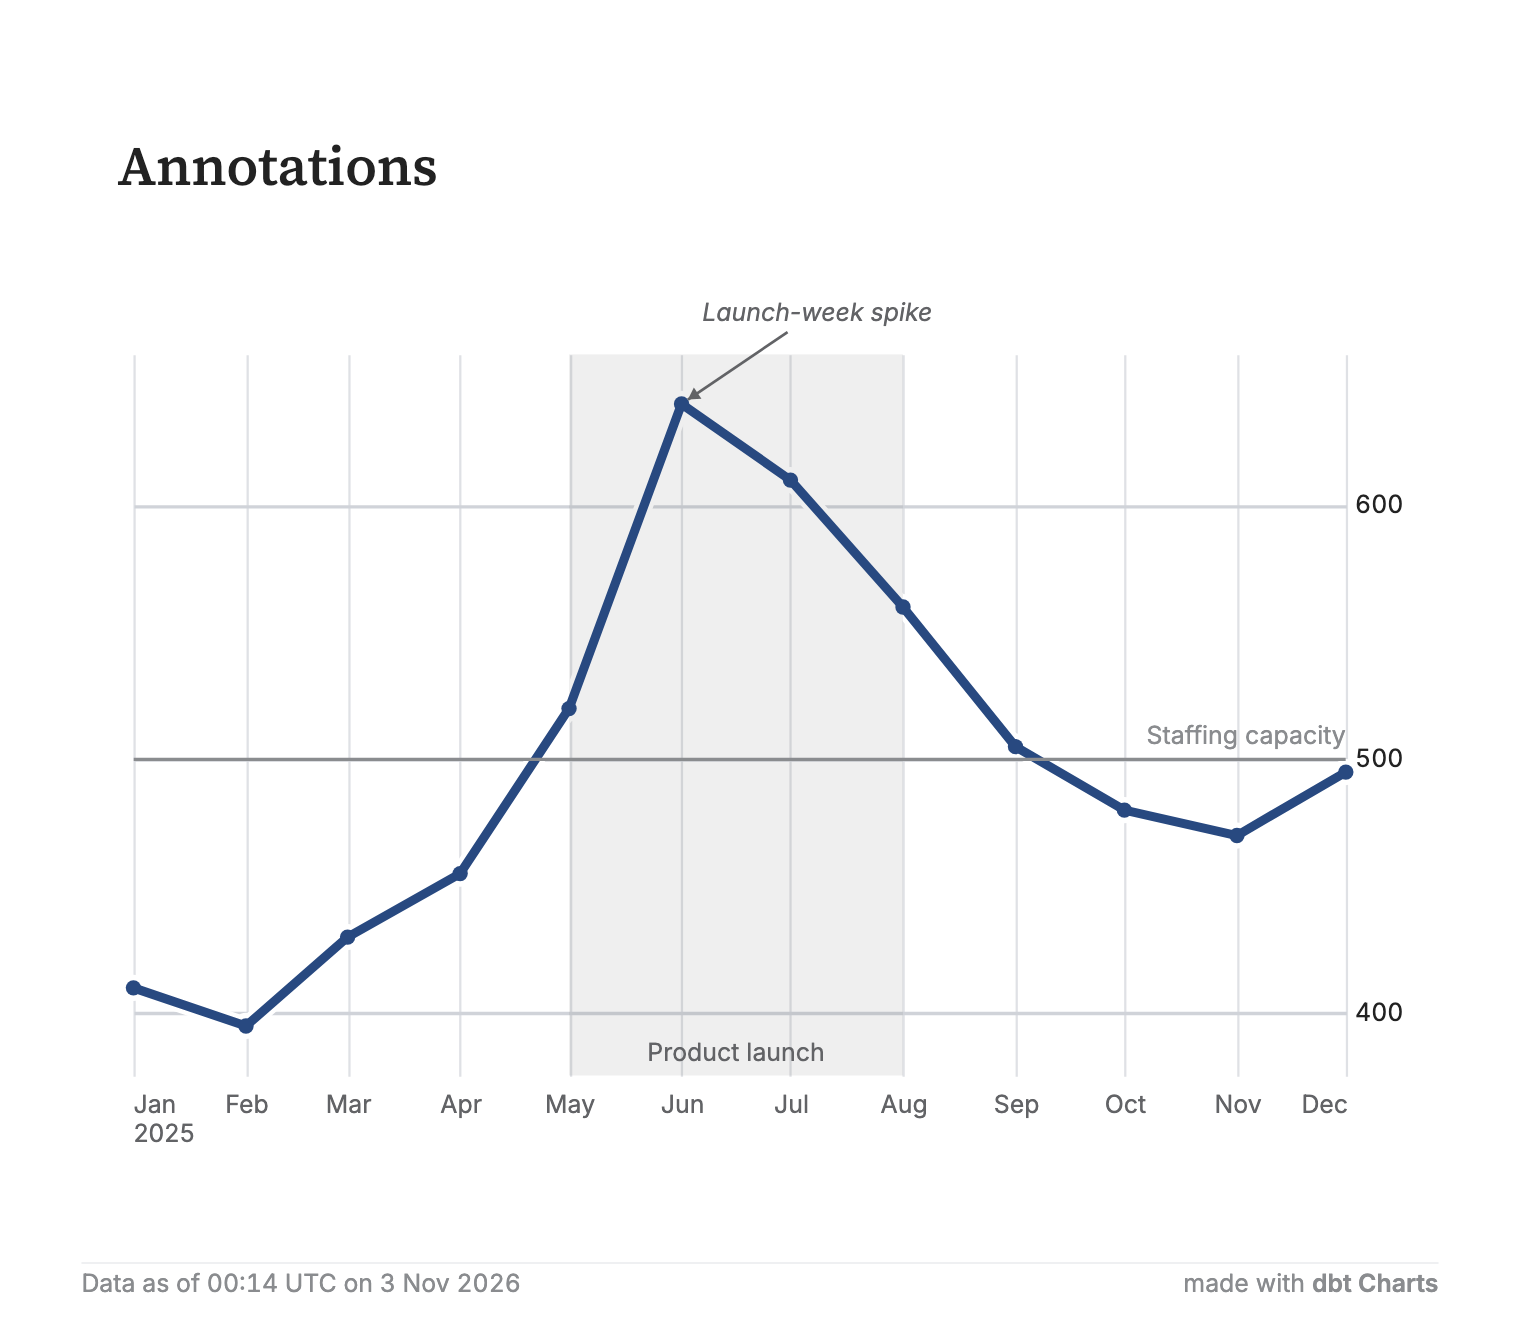
Rules, bands, notes and trend lines are now available as annotations on cartesian charts. Use a rule for a target, a band for a period or range, and a note for something the reader should notice. Trend lines work over line and scatter marks. Thanks to Koba Khitalishvili for requesting trend and summary overlays.
Table sorting and filtering
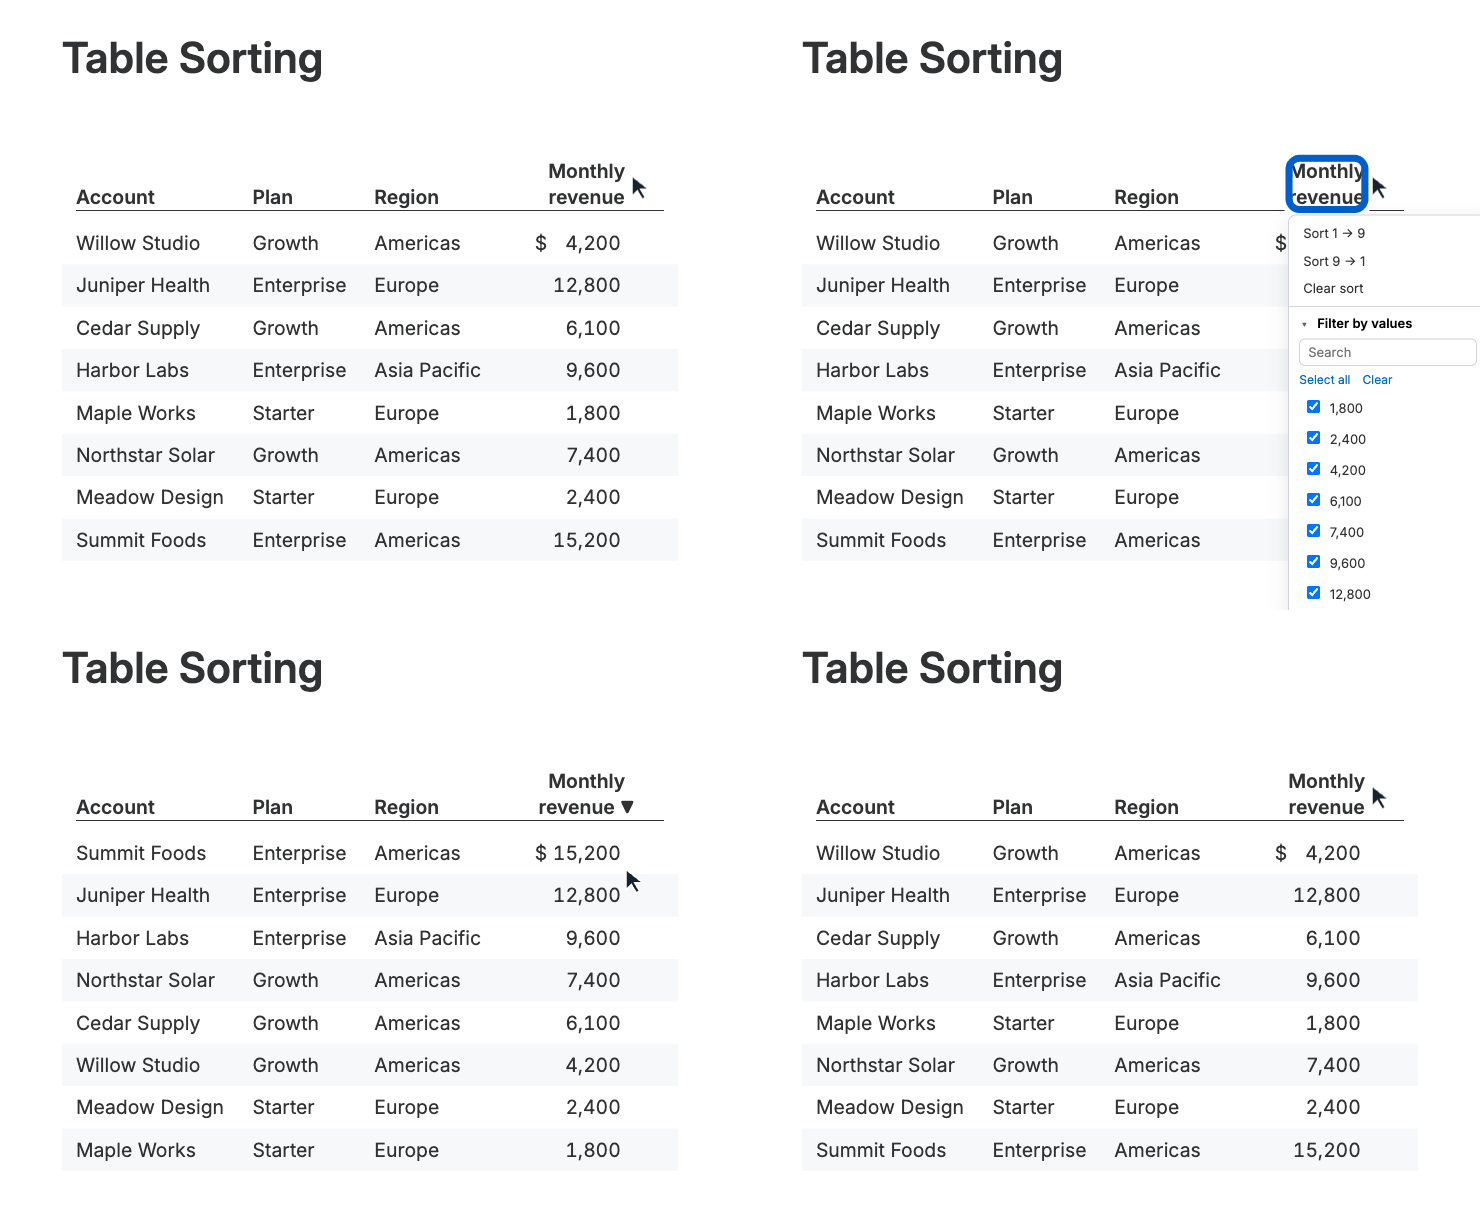
Tables now let readers sort and filter rows in the page. Column menus use the language of the data: A to Z for text, numerical order for numbers, and oldest to newest for dates. Date columns can be filtered with a calendar range.
Choose a value, change the sort, and inspect the rows that remain. Boards with two or more filters also have a Reset control that returns every filter to its default. Thanks to georgea-tk for requesting interactive table sorting, and Tracy Chow for requesting filter reset.
Date presets and reporting calendars
Date filters now support presets such as last_30_days,
previous_3_quarters and this_fiscal_quarter, resolved on each render. Boards
can set their time zone and fiscal year start month. The date picker’s preset
menu is configurable.
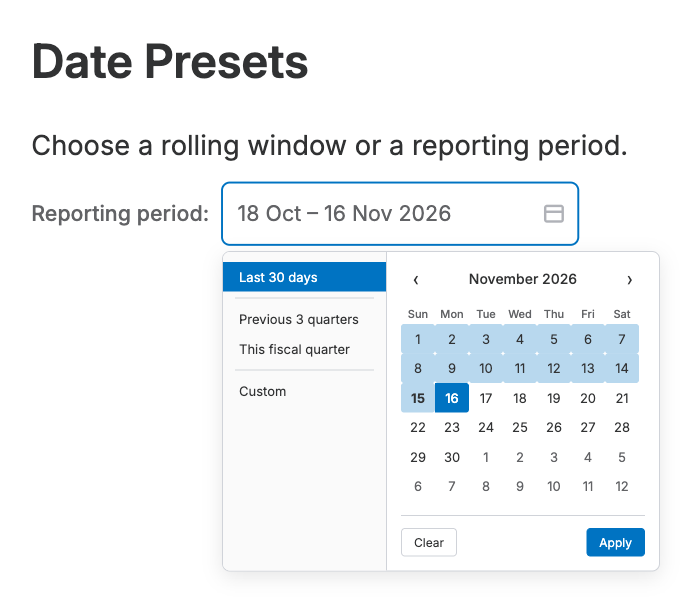
Last-N-month presets include the current month and the N-1 months before it. Last-N-days presets use a rolling day window. Thanks to georgea-tk for requesting relative date ranges.
Board tabs
Tabs can now sit in a vertical rail beside the board’s content. Tab labels size to their text, and a rounded outline marks the active tab. Thanks to finndethlefftk for reporting the vertical-tab issue.
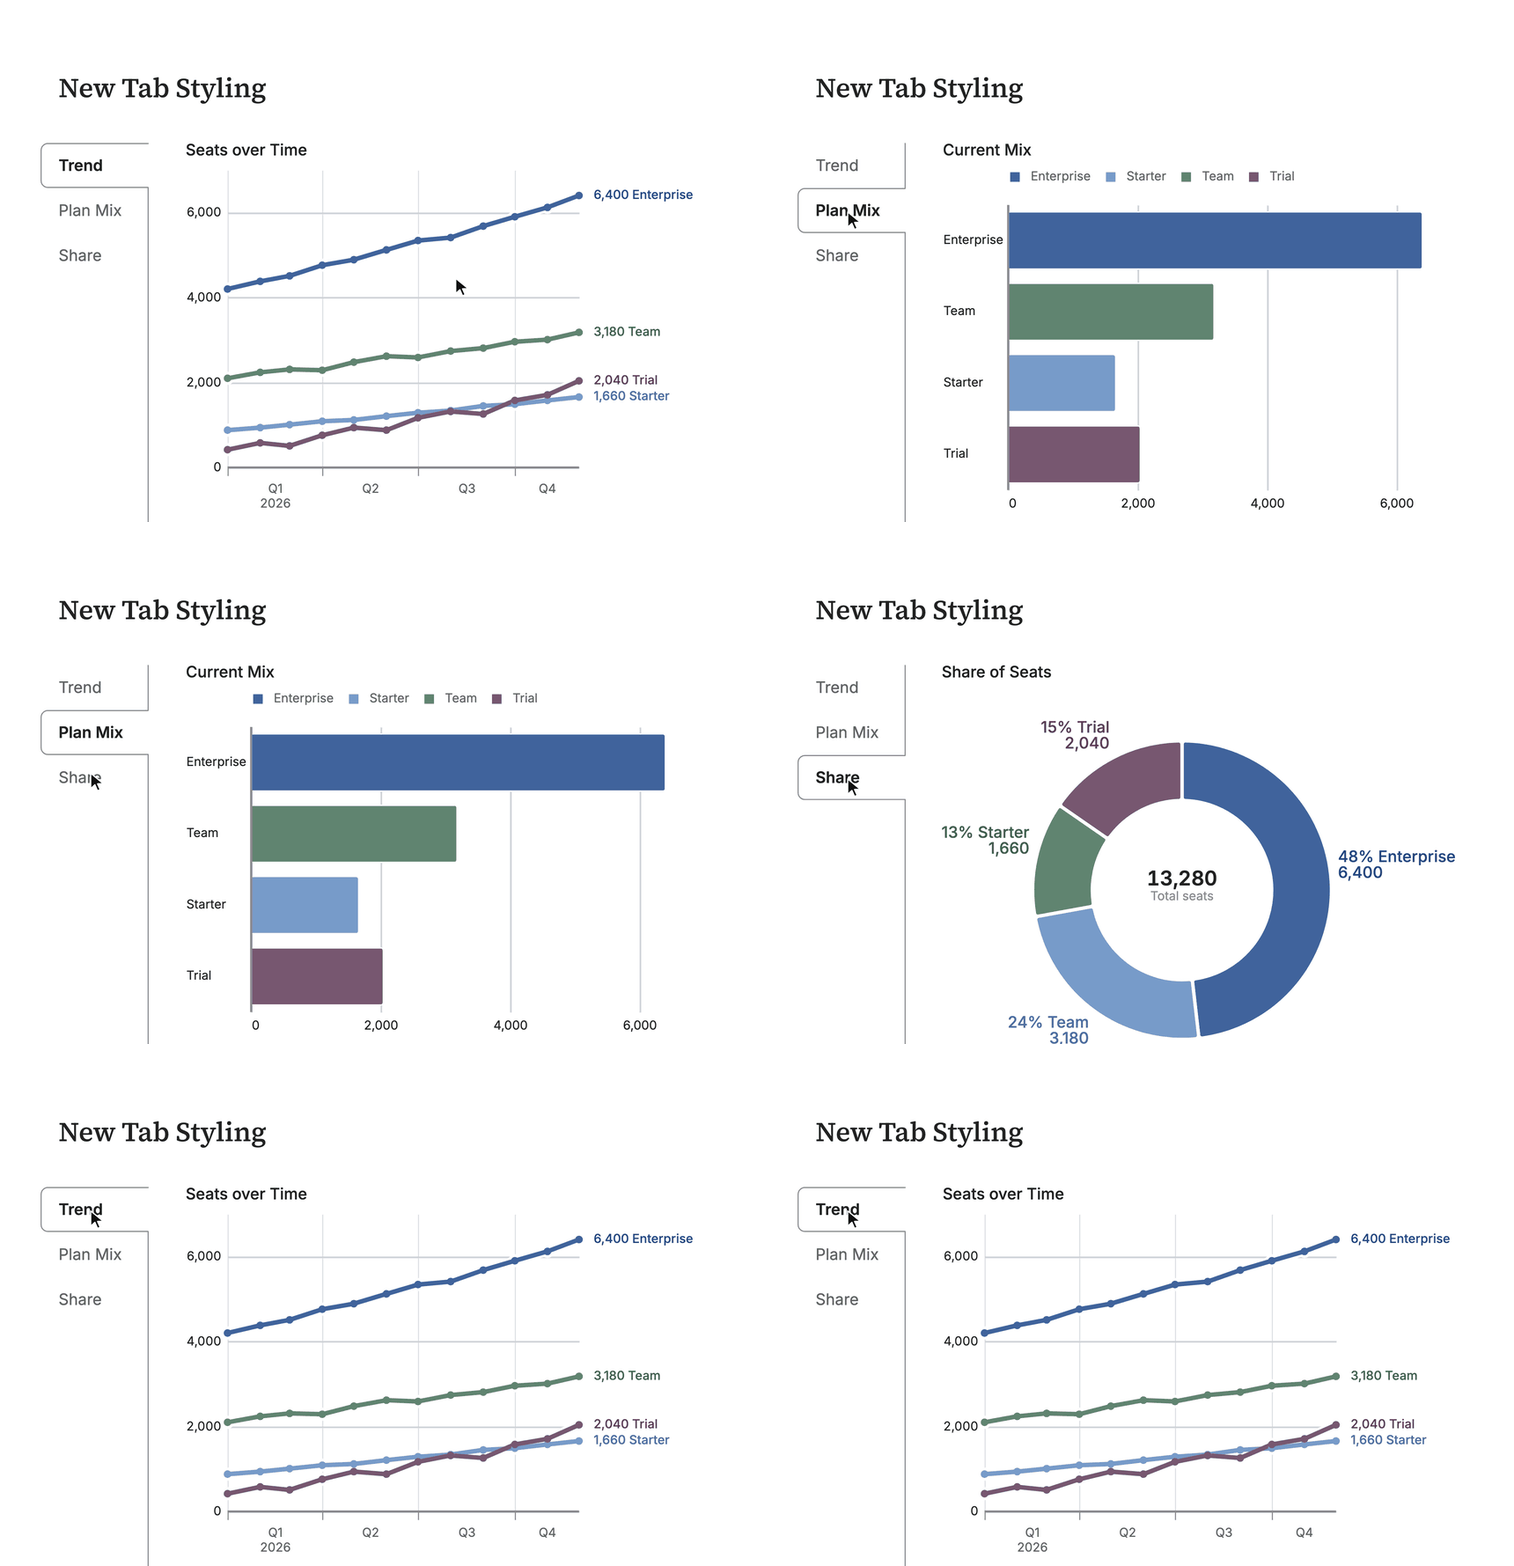
Tabbed boards run only the open tab’s queries. Set prefetch: true under
cache: to load the other tabs in the background.
Import tools
dct import now fetches source bundles from
Looker,
Sigma,
Hex and
Omni. An
agent reads the bundle to build a dbt Charts board and compare its numbers
with the source. See the import guide
for setup and tool-specific walkthroughs.
dbt exposures
dct exposures writes a dbt exposure
for each board that references dbt models or sources. Commit the generated file
and run dbt parse to include the boards in dbt lineage. Thanks to
georgea-tk for
requesting boards in the dbt graph.
Charts in Markdown
A charts code fence now renders a chart inside a Markdown document. Supported
integrations include MkDocs and Pelican, with a render step for other static
sites and GitHub READMEs. See
Charts in Markdown.
Others
There are smaller additions across charts, boards and the tools around them:
- Pattern fills: bar, area, pie and heatmap charts support hatch, dot and dash textures.
- Selected value labels: label just the first, last, minimum or maximum value in each series. Automatic labels also avoid marks and other labels; explicit positions stay fixed.
- Connected scatters:
connect:names a column, and points connect in that column’s order instead of x order. - Layer styling: hide individual layers from the legend with
legend: false. Constant reference lines no longer get automatic point marks, and dual axes support separate colors and dashed grids. - Histogram bins: automatic bin widths use round numbers and aim for about ten bins.
- Color scales: gradient
nicerounding works on tables, color channels and maps. Thedbt-graysanddbt-creamspalettes use numbered steps; older names migrate automatically. - KPI direction:
good: uporgood: downmakes headline and support-line glyphs and colors follow the value’s sign. Narrative formatting usesmfor millions. - Series selection: variable-setting links in bar, area and pie charts emphasize the selected value in SVG, PNG and PDF. Hovered lines come to the front, stacked charts retain their labels, and a Clear control resets series selection.
- Larger hover cards: stacked and grouped charts show up to 100 series, with configurable cutoffs. Thanks to Tracy Chow for reporting truncated tooltips.
- Filter menus: search long lists, show only selected values, sort alphabetically, and see or sort by row counts on column-bound filters.
- More date ranges:
before_previous_ranges, such asbefore_previous_4_fiscal_quarters, select everything before the previous N units, without a lower bound. - Time zones throughout: aware timestamps in text, tables, KPIs, axes and tooltips follow the board’s time zone. Day buckets and ticks follow local midnights across daylight-saving changes.
- Readable labels: generated labels use sentence case and readable units, such as “Weight (lb).” Authored titles and headers keep their case. Time-axis labels center on their periods and on-tick axes label endpoints.
- Text and fonts: secondary text has a named font slot; table row numbers, notes and spark-bar subtitles have their own slots. Section headings have a size ladder, Markdown headings align with chart titles, and Markdown tables size columns to their content.
- Table values: integers print whole and years omit thousands separators. Spark bars use a separate value column rather than labels inside the bars.
- Board navigation:
glob_boardsandglob_foldersbuild navigation lists in board text. Thanks to georgea-tk for requesting automatic board navigation. - Board folders: set
boards_dirto serve boards from a folder other thancharts/. - Streamlit projects:
st_project()serves all of a project’s boards in one app. - Chart toolbar hooks: hosts can add info, filter and share buttons with
registerChartButton. - Custom charts: templates gain D3 scales, ticks, curves, shapes, layouts, map projections and formatting helpers, plus
format(column=...),label_ink(color)andvariant(color, kind). - Migration guidance: the board-migration skill covers Looker, Sigma, Hex, Omni and screenshots, including source-specific SQL, calendar presets, stacking, axis bounds, notes, totals and empty-value conventions.
- Agent setup: one versionless installed skill points agents to the current chart guidance, including annotations, targets, pacers, bullet and waterfall charts, and saving through the Claude and ChatGPT connectors.
- Query discovery: agents can find relevant boards and queries with cached rows and read those results without another warehouse call. Search results also list available SQL sources.
- CLI search and inspection: search accepts several unquoted words and names the query behind each chart. Describe accepts a board title and includes query SQL.
- Project setup: initialization starts without a sample board; the local server shows an introduction until you add one.
- Schema locks:
locked_schema_versionpins the syntax a project targets, caps migrations and suppresses warnings introduced after that version. - Authoring diagnostics: errors appear before warnings. Diagnostics flag unused queries, repeated defaults, crowded labels, narrow table columns, missing time periods and a heading used without a board title.
- Query validation: values queries identify mixed-type or all-null columns. Athena errors identify array, map and row columns that need a JSON cast.
- Connection setup: create a Cloud connection and map project sources in one command. Connection listings identify the warehouse principal in use.
- Snowflake authentication: sources support workload identity providers, including Entra resource configuration.
- Member roles: change all members with a given role using
dct cloud member role-all, with a dry run to preview the change. - Python 3.14: the package now installs and runs on Python 3.14.
A few community-reported fixes are worth calling out, too. Thanks to Josh Andrews for these reports:
- Layer and support-table formats: query formats now reach a layer’s own axis and support-table aggregate rows (report #74).
- Single-chart titles: a board without an explicit width makes room for a lone chart’s title, up to the maximum board width (report #42).
- Year-like category colors: board-wide color pins work for text values such as “2020” (report #75).
- Long time-series layers: layers stay aligned with the base chart beyond 60 time buckets (report #80).
The full release notes include the remaining fixes and technical changes.
Upgrade
uv tool upgrade dbt-chartsSupported older YAML syntax migrates automatically when a board loads. Run
dct migrate to save those syntax updates to your files. The
full release notes
cover changes to older integrations and setup scripts.
Try 0.11.1, bring a board to office hours, start a thread in the dbt Community Slack, or open an issue.
We look forward to seeing what you make with it.