The platform
BI unbundled
The charts are code in your Git repo. dbtCharts.com is the rest of BI: conversational analytics, a visual editor for everyone else, and hosting with access control.
Connects to Snowflake, BigQuery, Redshift, Postgres, and DuckDB.
Conversational analytics
Charts built for chat.
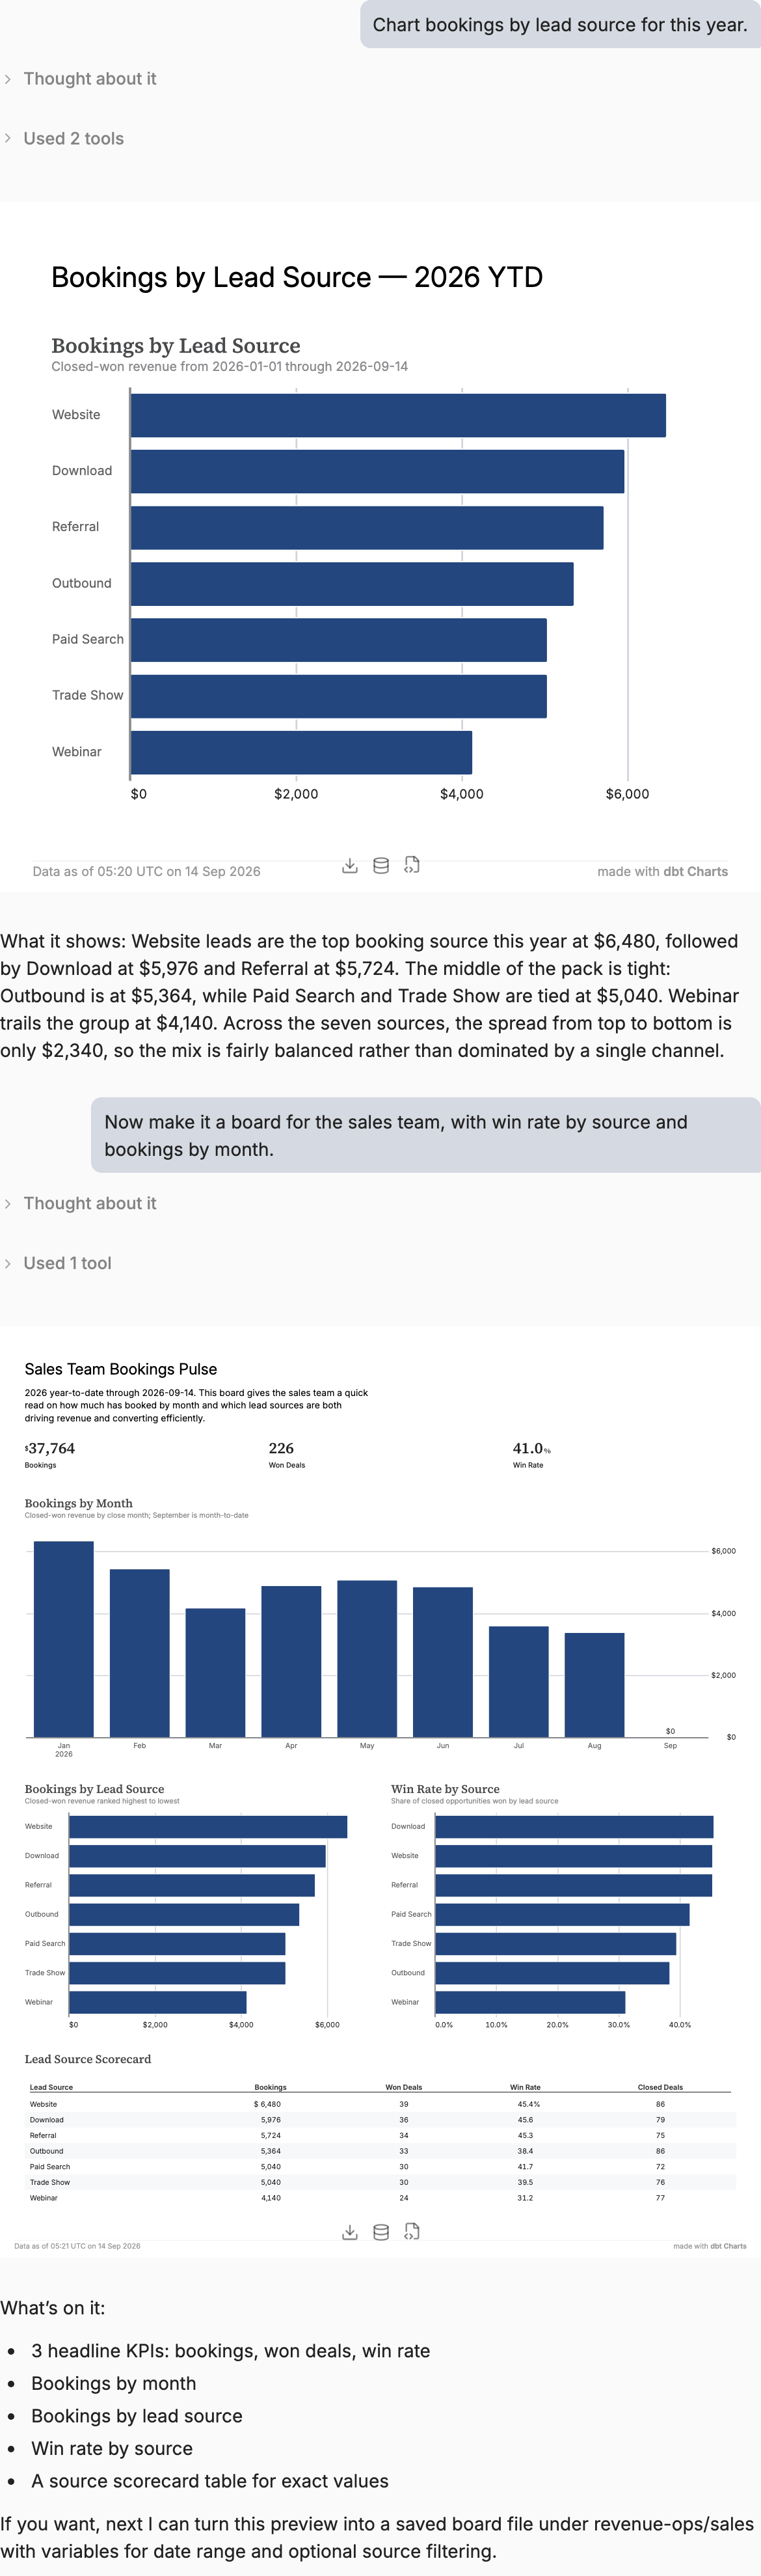
Ask a question and get an analyst's answer: a chart, a full board, or a written report with the numbers in it. It writes a few lines of YAML, and built-in tools check the result before you see it.
Nothing it makes is a throwaway. Every board in the thread is dbt Charts, so saving it lands it in Git, and it re-renders on fresh data whenever it opens.

UI
Start with chat. Polish by hand.
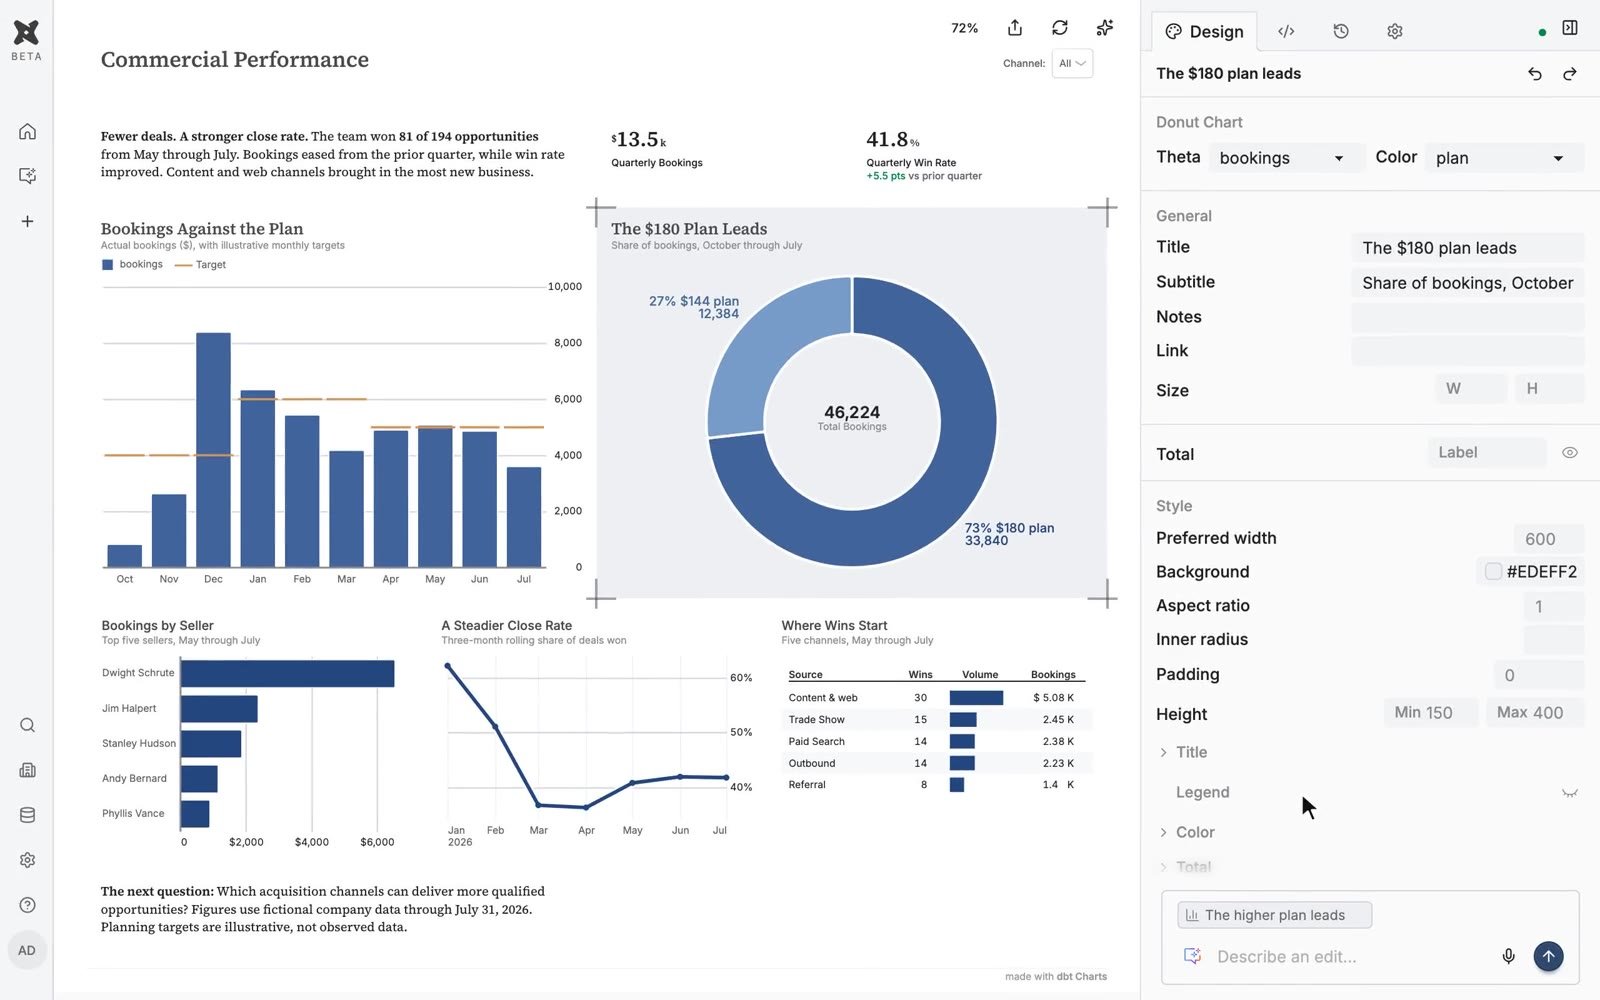
Click a chart to see its styles. Double-click any text to retype it. The design panel is generated from the language itself, so every setting has a control, and every change lands straight back in the YAML.
Hosting & access
Share a live board, not a screenshot.
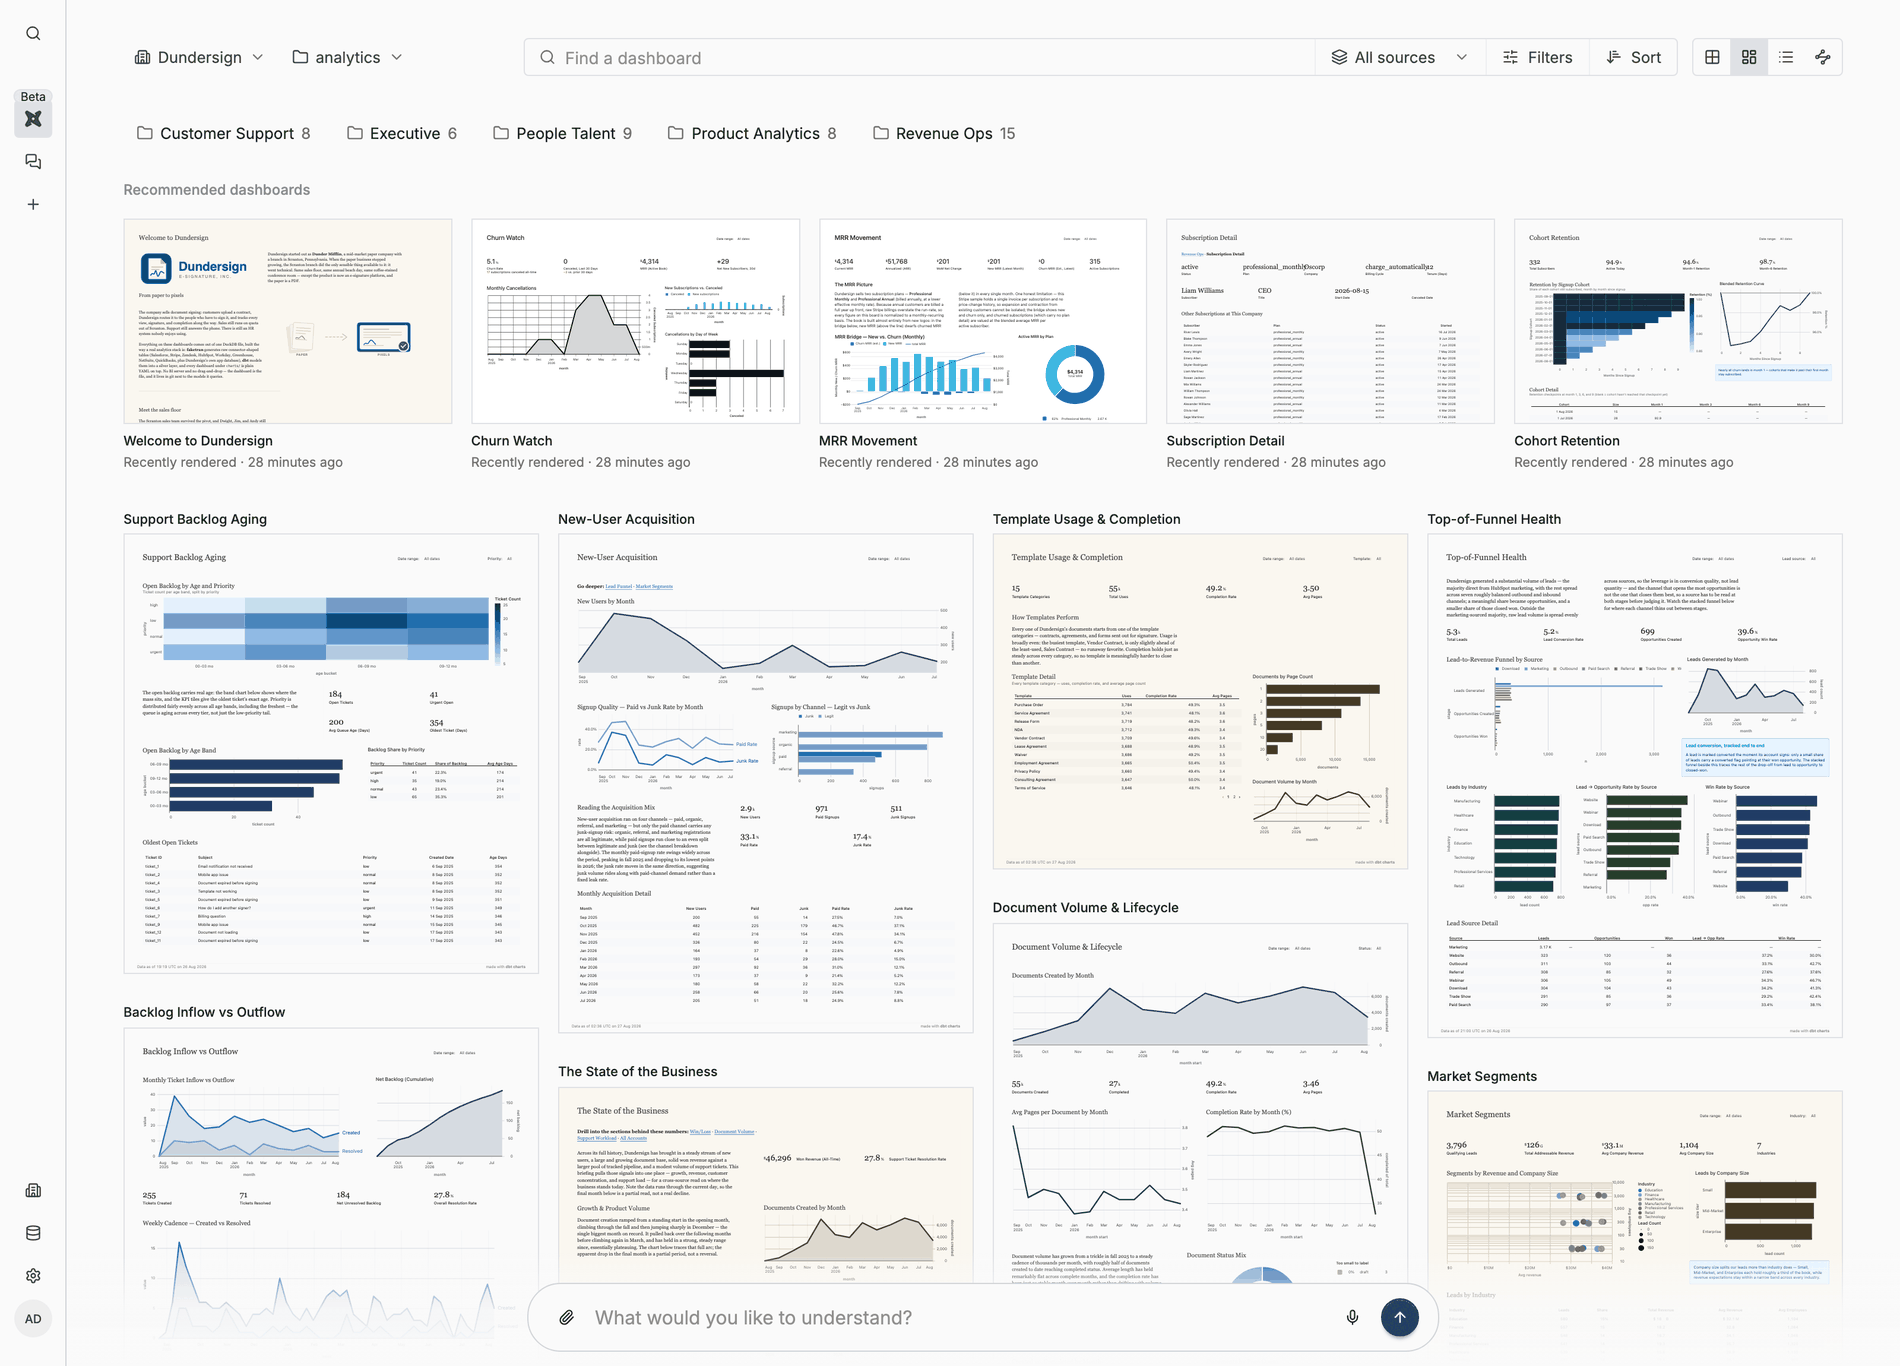
A link that opens on live data, for the people who should see it, in one shared place. Nobody exports a screenshot, and everyone reads the same numbers.
Live when it opens
No warehouse login to read
View, edit, or query
Govern
Visual pull requests.
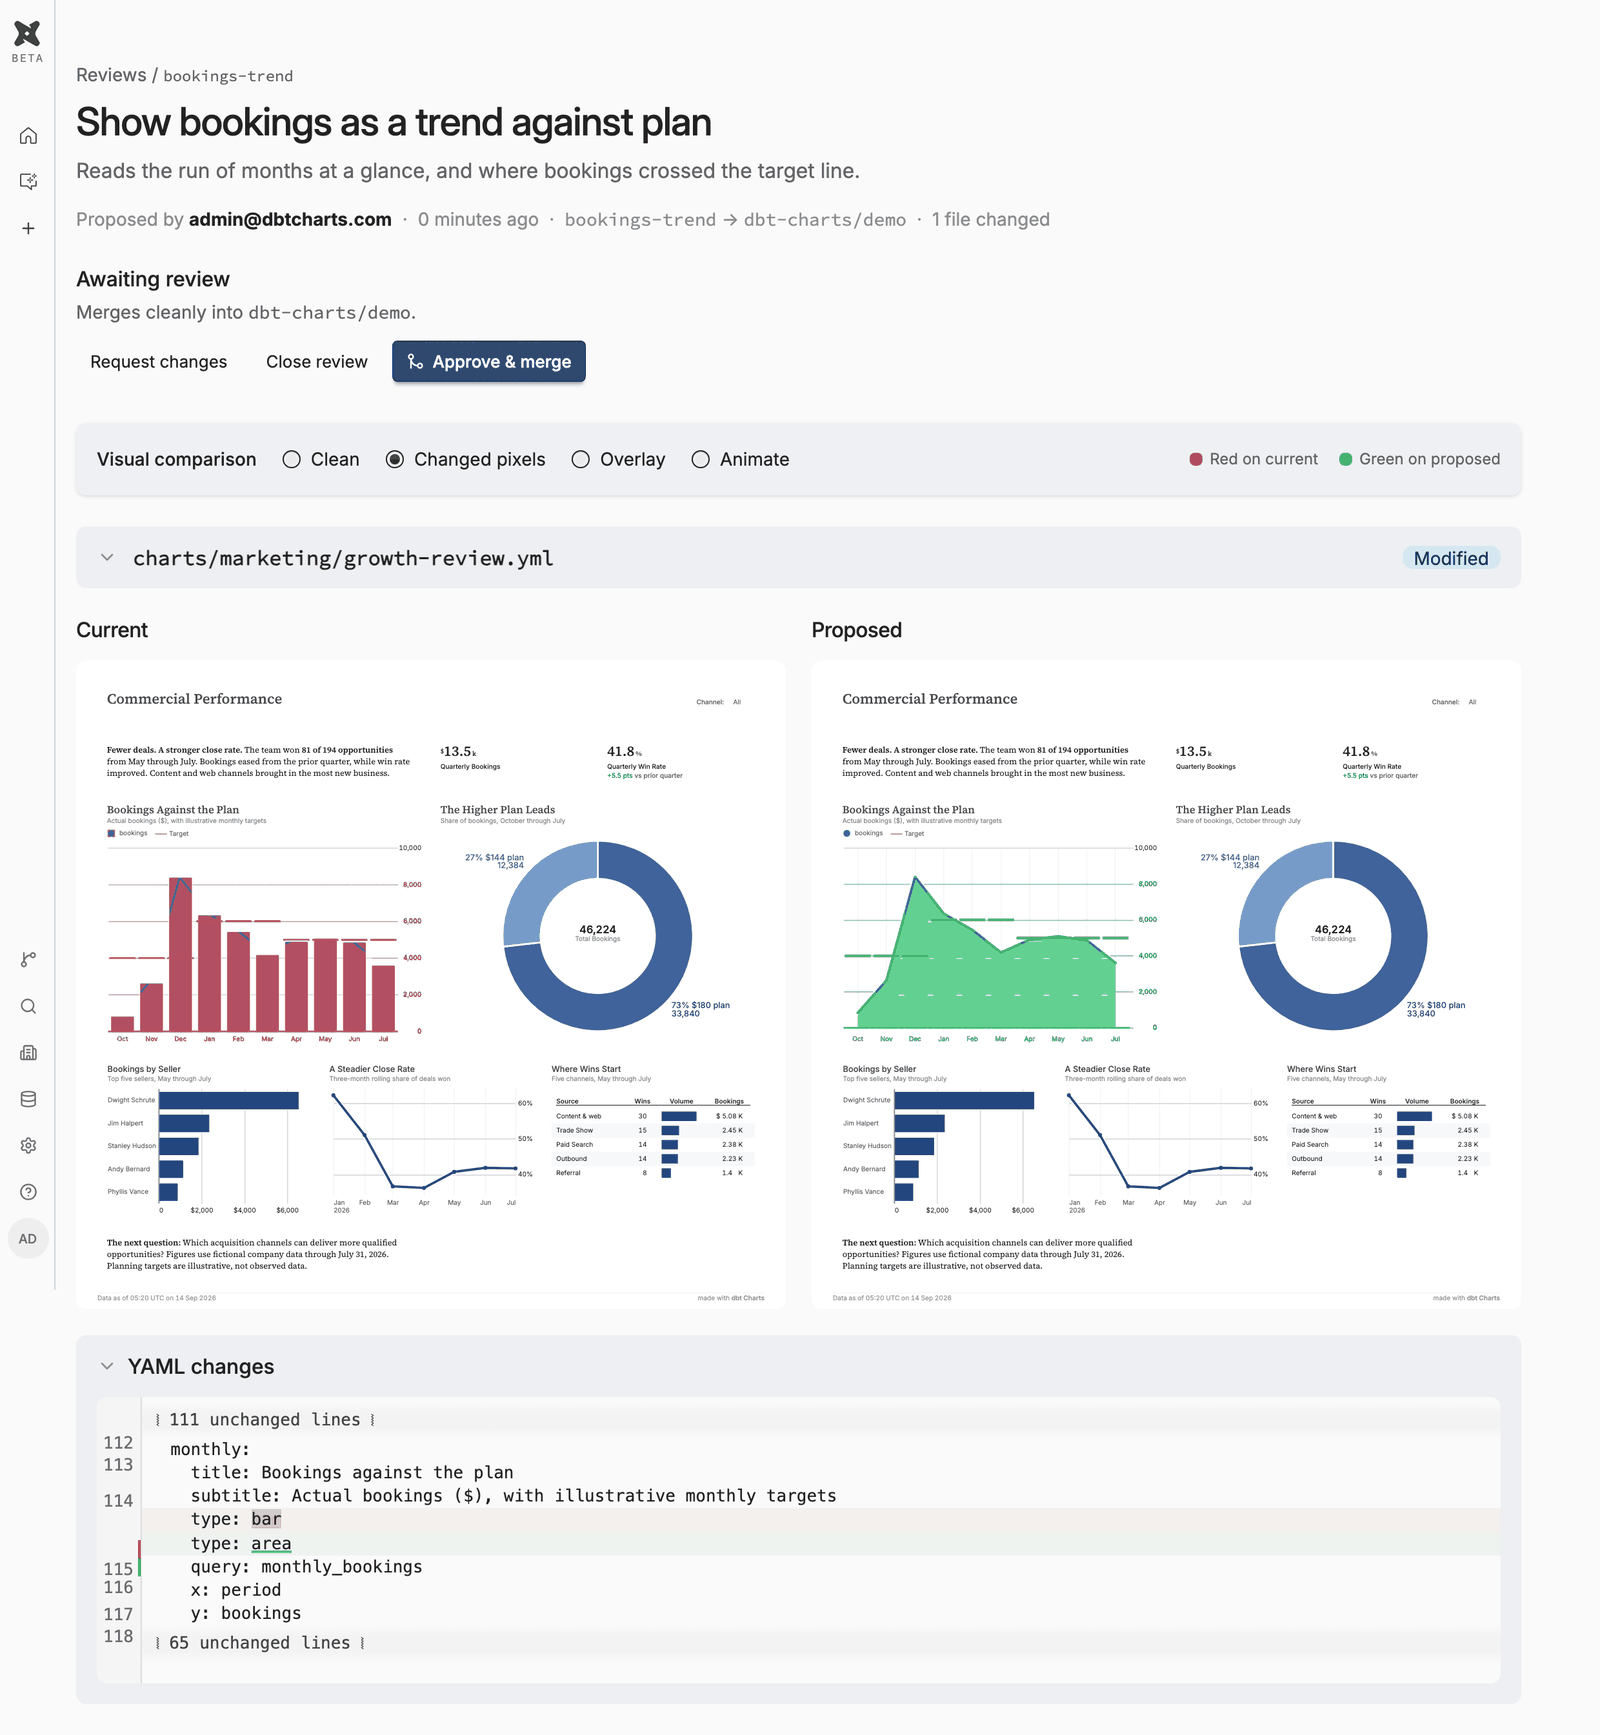
For teams that want more governance: turn on branch mode and every change to a board becomes a pull request, reviewed as a picture, not just a diff.
Branch mode
Off by default. On, every edit made on the platform starts on a branch and reaches the live board only through a review.
See the change, not just the diff
Both renders side by side, changed pixels highlighted, so a change nobody meant to make gets caught.
Migrate
Migrate your existing BI.
Drop a screenshot or export of a dashboard into the chat, or point the CLI at your BI tool's API, and the migration skills rebuild it as a dbt Charts board.
Setup and CLI
One CLI, from sign-in to invite.
The platform is built on the open-source CLI, so an agent with a terminal can do the whole setup: sign in, connect the repo and warehouse, invite the team.
Codex · Cursor
Make charts of this with dbt Charts. Start with: uv tool install dbt-charts && dct skills intro
uv tool install dbt-charts
In claude.ai or ChatGPT, with nothing to install? Start on dbtCharts.com ↗
Agents that arrive on their own read dbtCharts.com/llms.txt.
From install to a shared board
# sign in and create the organization
$ dct cloud login
$ dct cloud org create "Acme"

# connect the repo and the warehouse
$ dct cloud project connect --org acme
$ dct cloud connection create --type bigquery \
    --keyfile sa.json --set project=acme-gcp \
    --set dataset=analytics
$ dct cloud source map analytics acme-gcp
$ dct cloud project sync

# bring in the team
$ dct cloud member invite dana@acme.com
Underneath all of it
No lock-in.
Boards are plain files in your Git repo, Apache 2.0. The same board renders on your laptop, in CI, and on the platform. Leaving never means rebuilding.
Point it at your warehouse. Ask anything.
Start with the free workspace. Connect your warehouse and your dbt repo, then ask your first question.