dbtcharts.com platform
BI unbundled
BI tools used to own everything from the data to the dashboard. Now the charts are code too: every board is transparent YAML and SQL in your Git repo. So what’s left for BI? Conversational analytics, a UI for people who would rather not write YAML, and hosting with access control. That’s dbtcharts.com.
Conversational analytics
Charts built for chat.
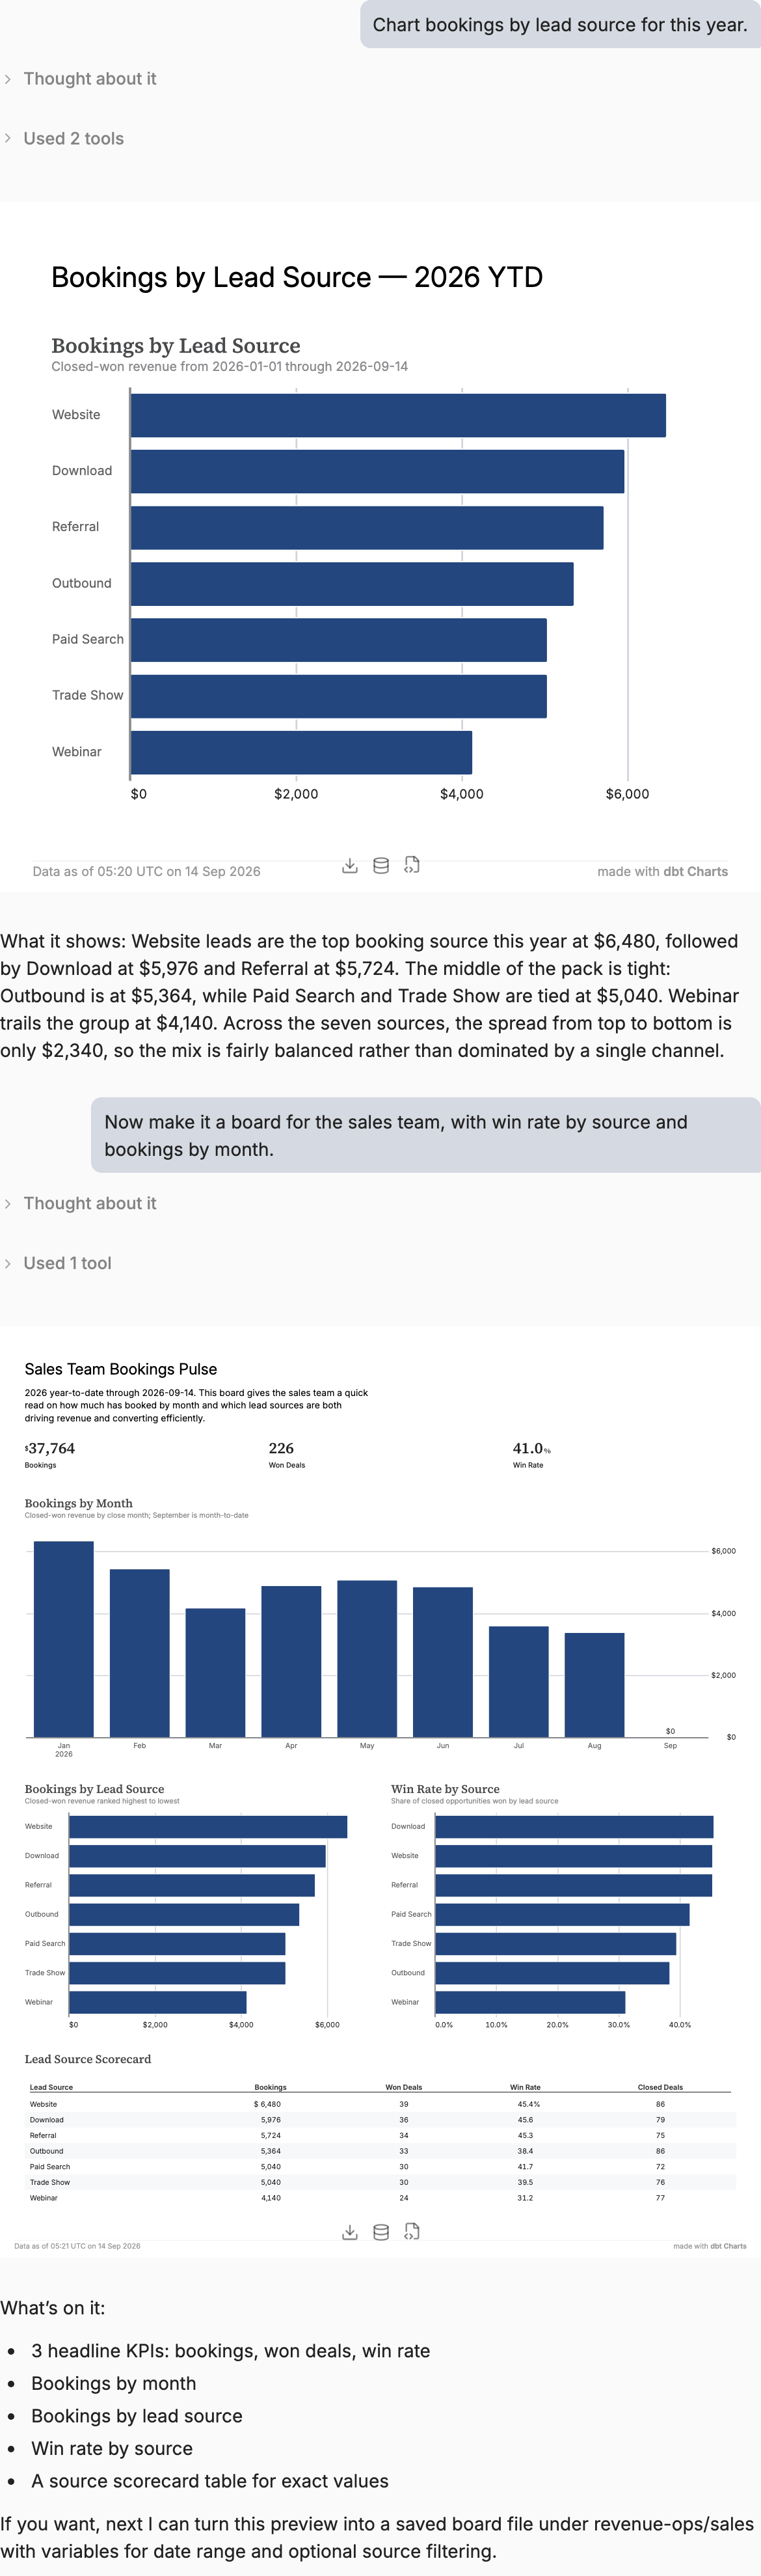
Ask a question and the agent answers the way an analyst would: with a chart, a full board, or a written report with the numbers in it. Whichever it is, the agent writes a few lines of YAML instead of wiring up HTML, a front-end framework, and a chart library.
The built-in tools do the rest: read your schema, run the query, render the result, and tell the agent what to fix before you ever see it.
And what it makes is not a throwaway. Every chart and board in the thread is written in dbt Charts, the same language as every other board in the project. Save it and it lands in Git with history and review like every other board, and it re-renders against fresh data whenever it is opened.

UI
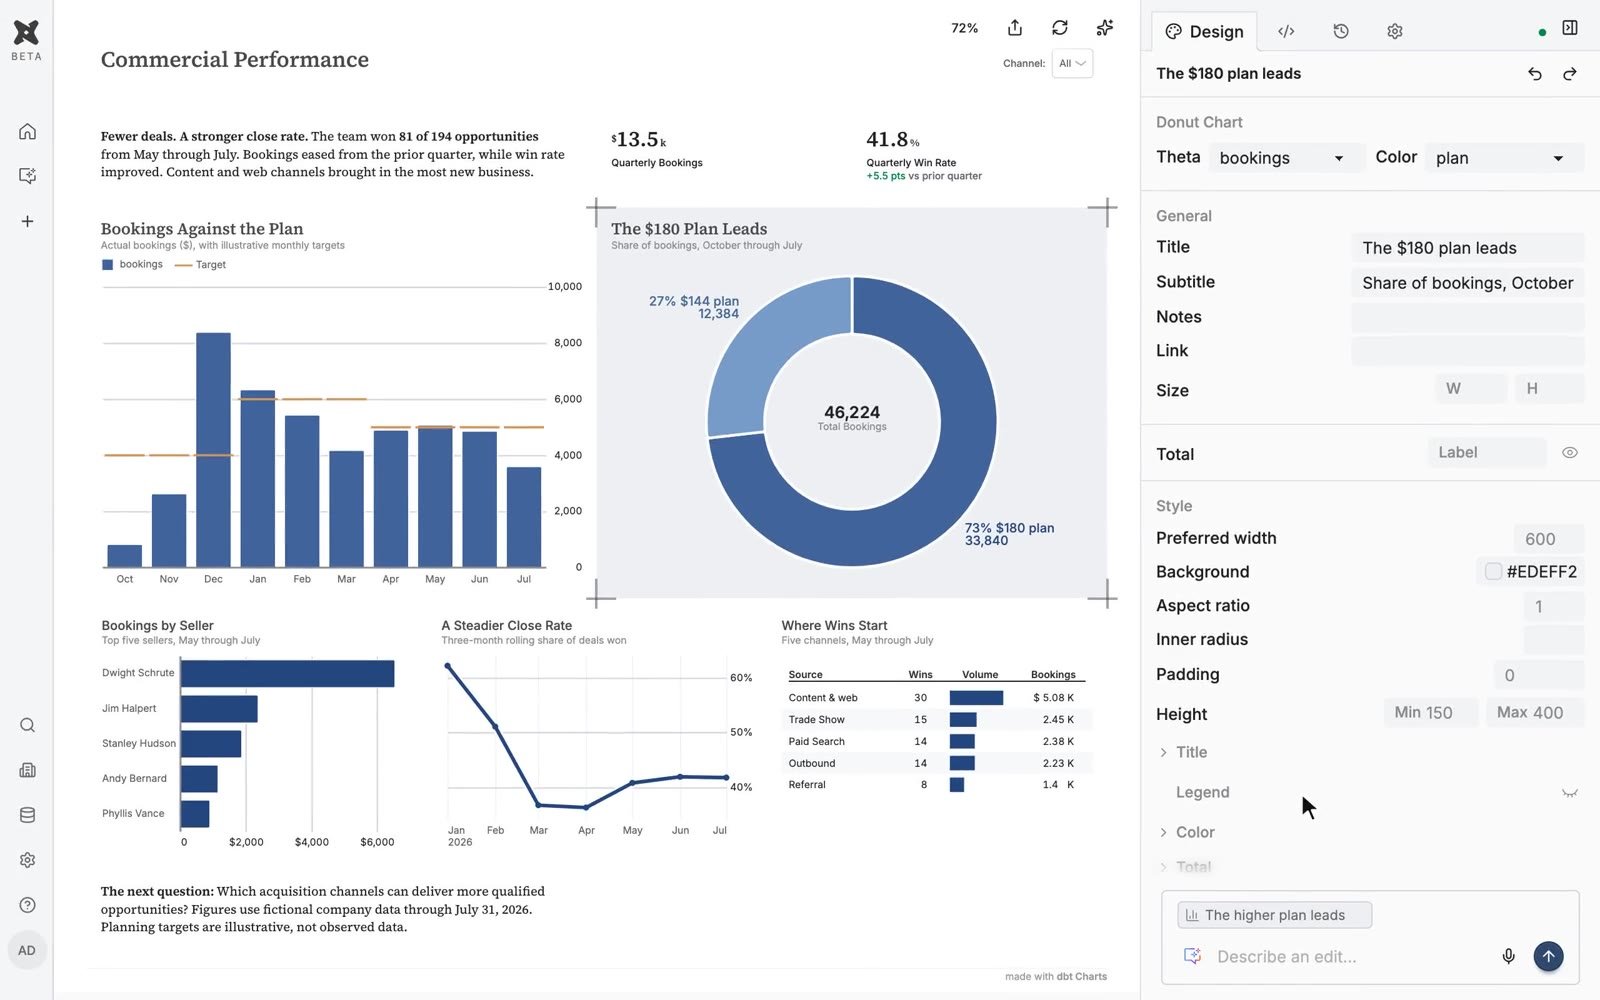
Start with chat. Polish by hand.
Click a chart and the design panel shows its styles. Double-click any title or line of text on the board to type over it. Every edit is written to the same YAML the agent wrote, so there is one board, not an AI copy and a human copy.
Hosting & access
Share a live board, not a screenshot.
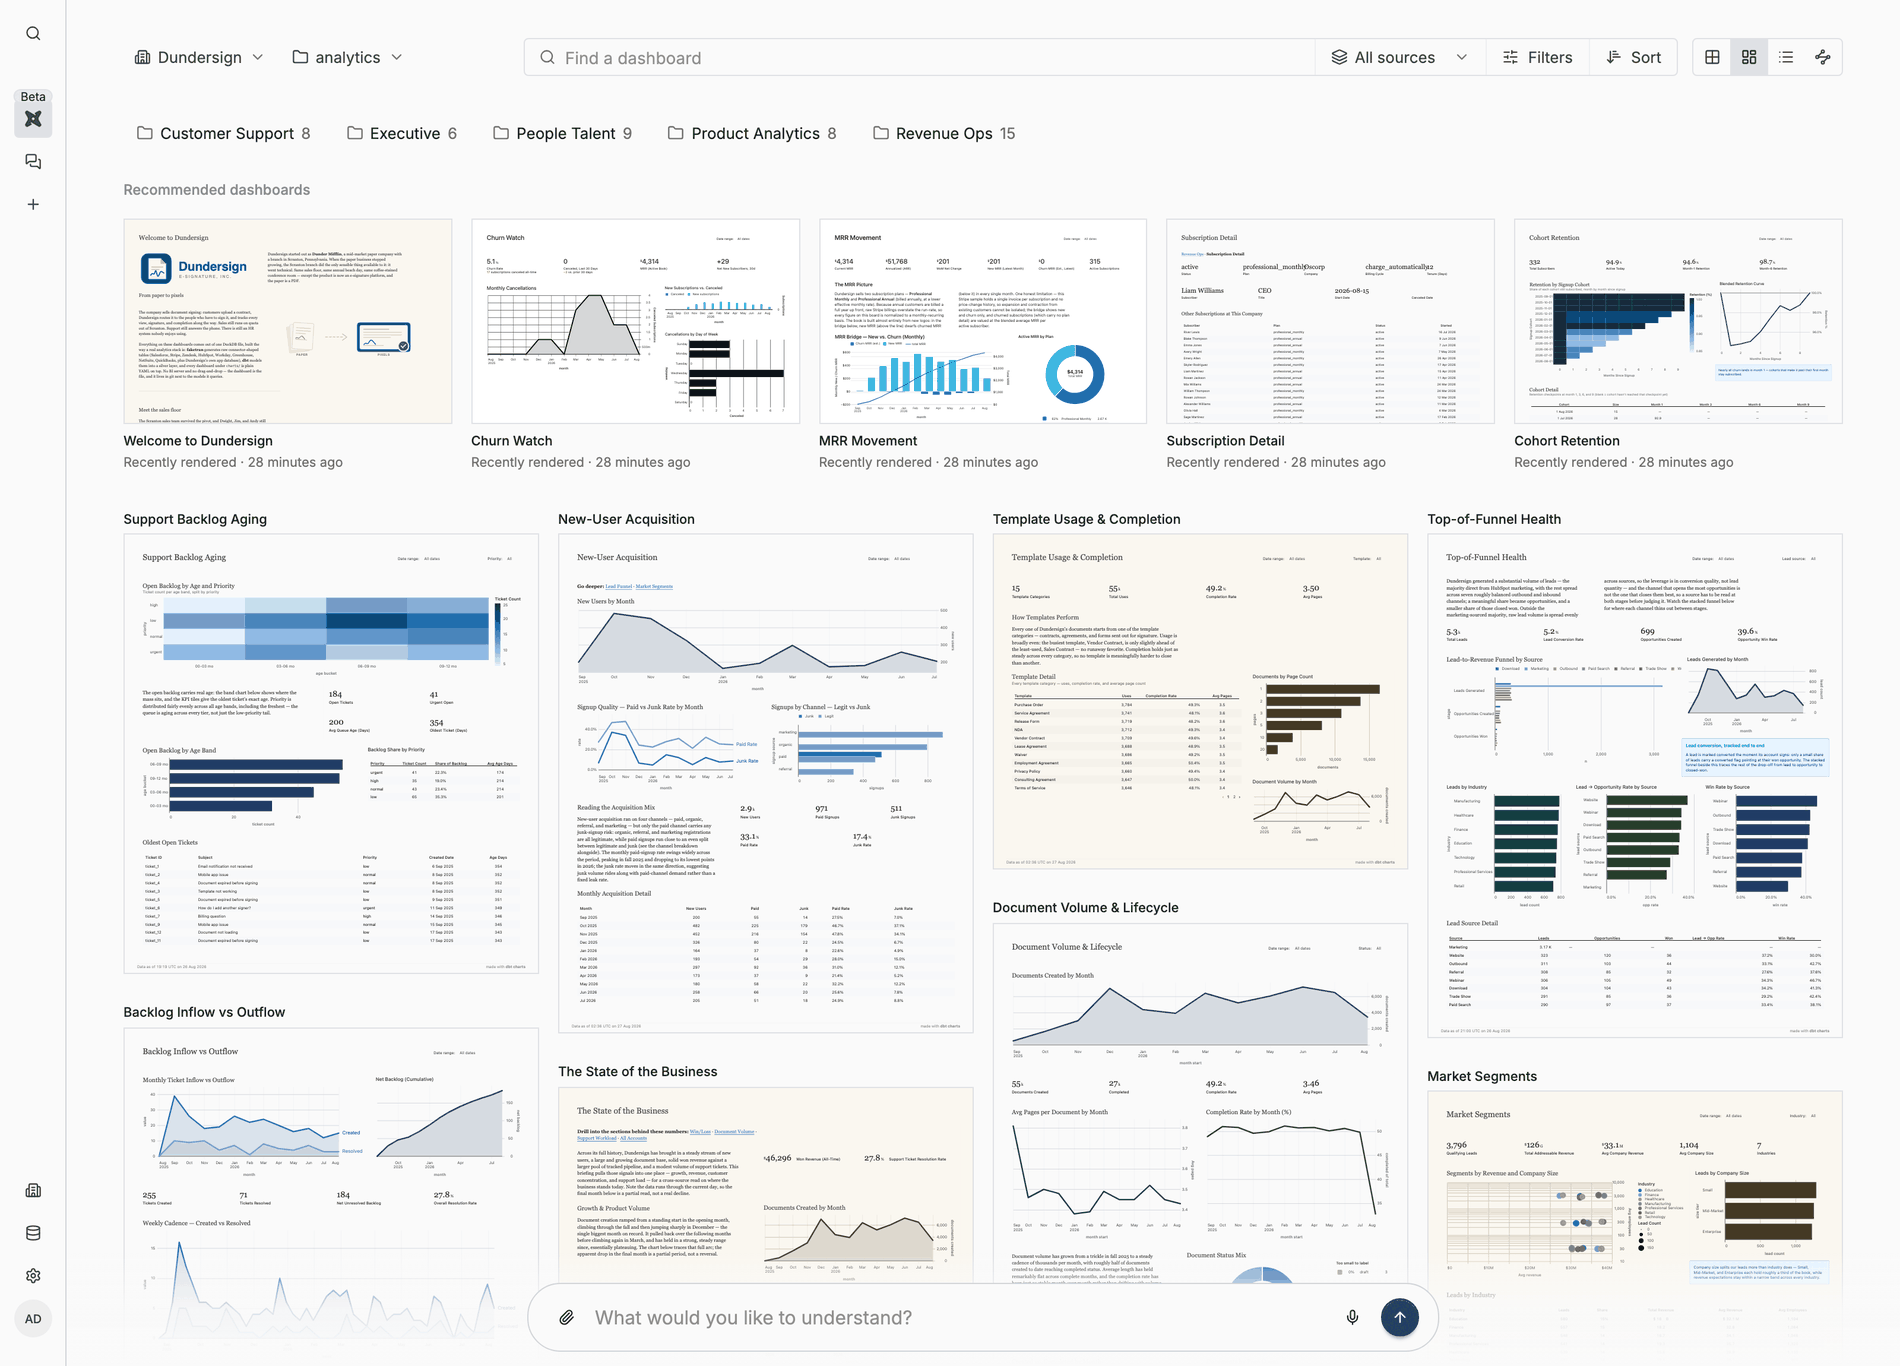
Hosting is what turns a board into something the team works from: a link that opens on live warehouse data, access set by who should see it, and one shared place to build on each other's work. When sharing is that easy, nobody exports a screenshot or rebuilds the chart in a spreadsheet, and everyone reads the same numbers.
Live when it opens
A board link runs against your warehouse, not a snapshot, and scheduled renders keep the busy ones fast.
No warehouse login to read
The platform queries through the project's connection, so readers get the answer without credentials of their own.
Who can view, edit, or query
Share each board with people or groups to read or change it, and decide who can write and run new queries against your connections.
Govern
Visual pull requests.
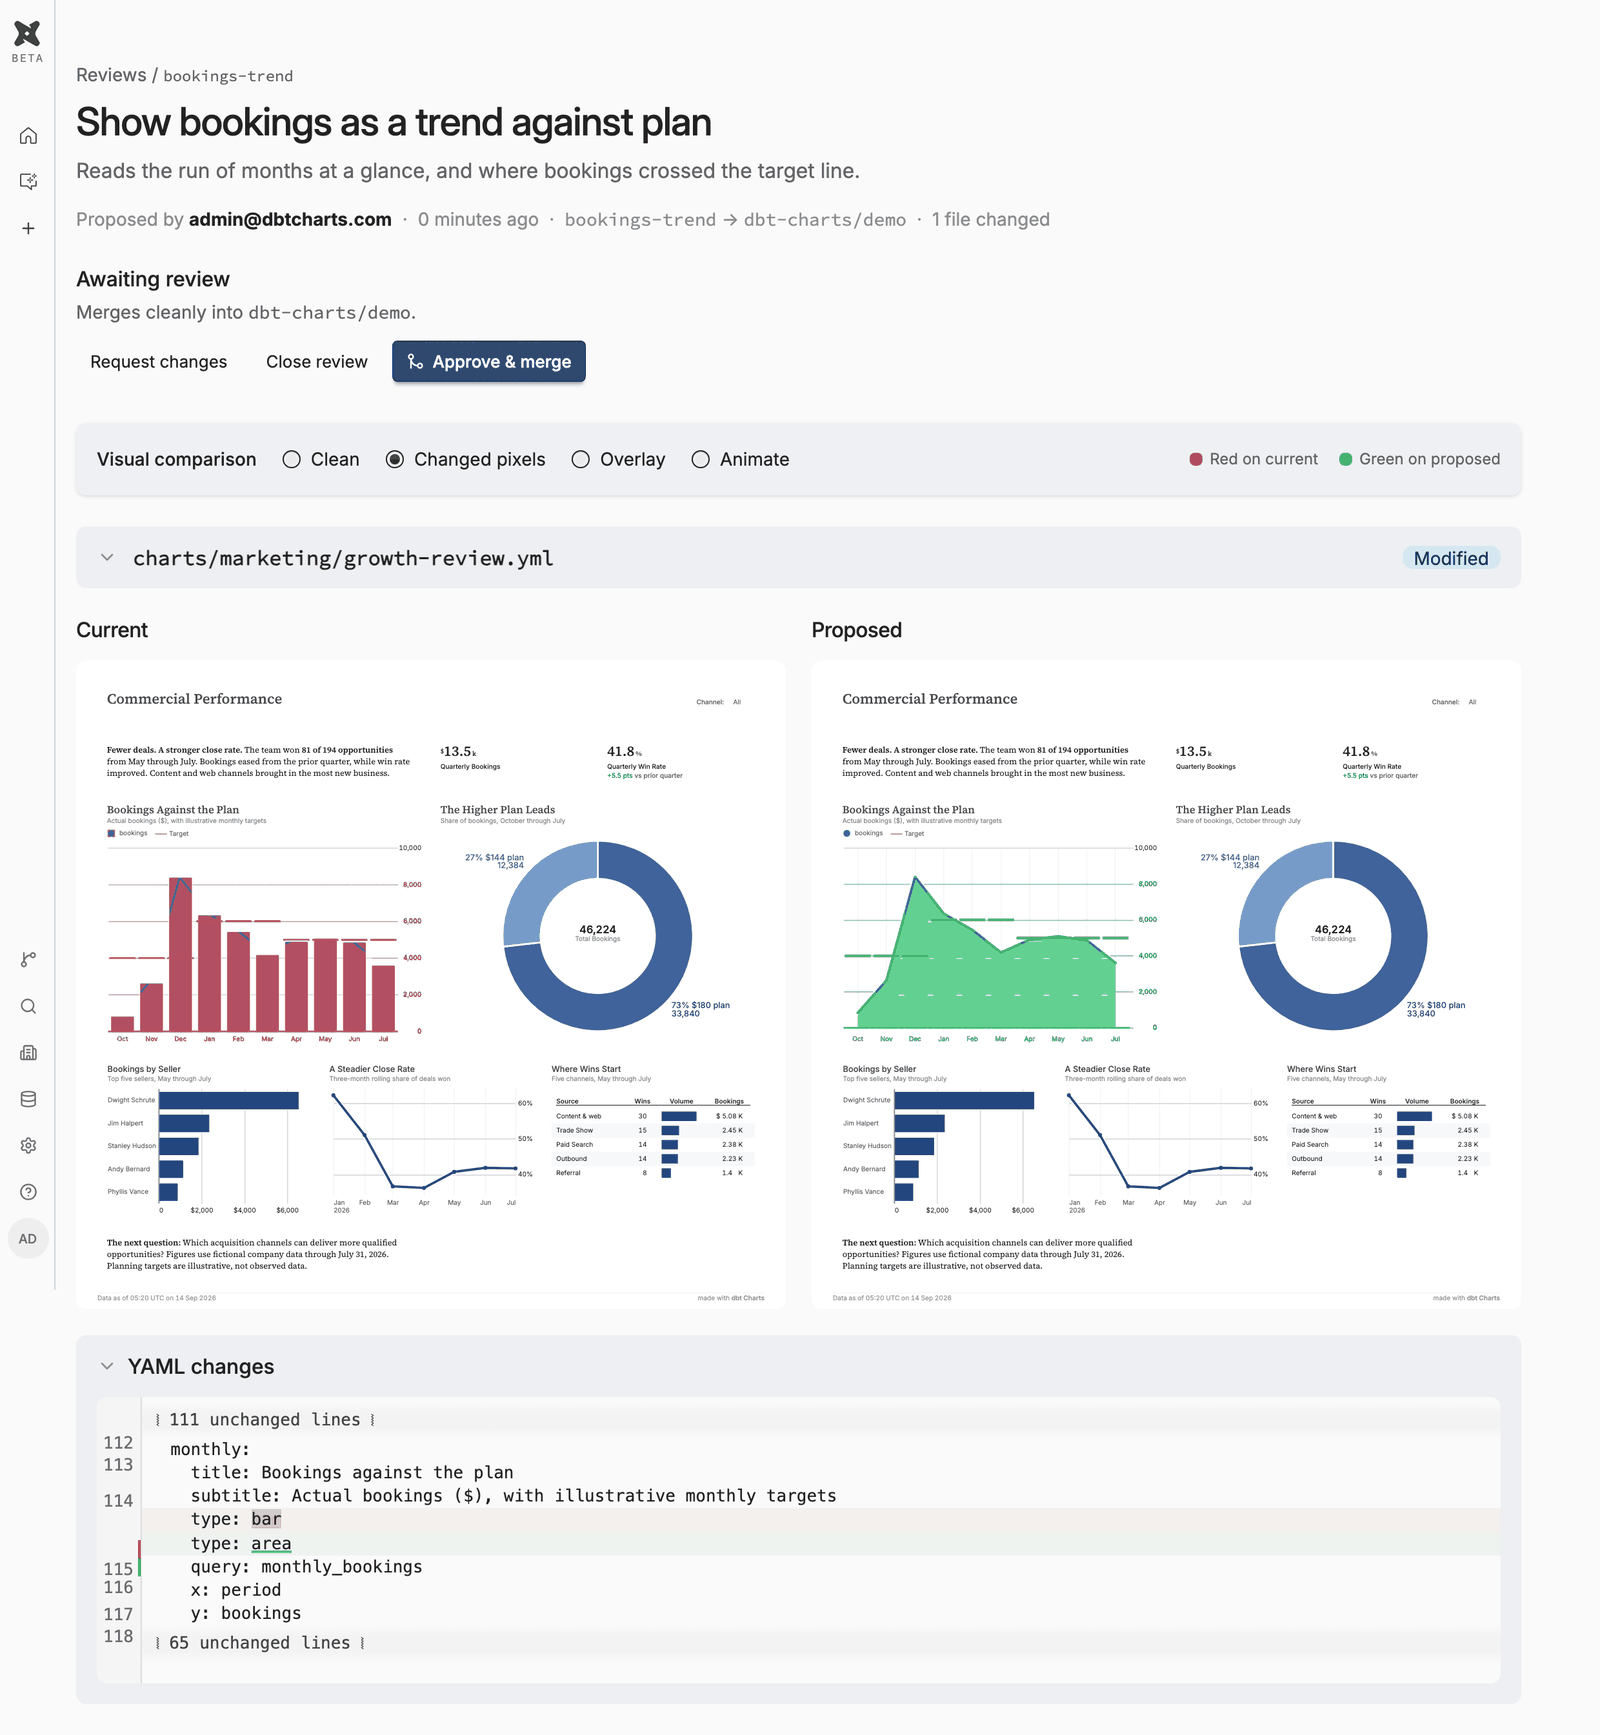
A change to a board goes through a pull request like any other code, and the review shows the board rendered before and after beside its YAML diff, so the reviewer approves what readers will actually see.
Branch mode
A per-project switch for controlled collaboration. With it on, every change made in dbtcharts.com, by anyone, starts on its own branch and reaches the live board only through a review.
See the change, not just the diff
Compare the two renders side by side, highlight the changed pixels, overlay them, or flip between them, so a change nobody meant to make is caught where it would be seen.
Built into dbt
The chart layer belongs next to the model layer.
Your charts/ folder sits beside models/ in the
same repo. A column rename and the boards that read it ship on the same
branch, in the same pull request, through the same CI, so the model and
its charts never drift apart.
your_dbt_project/
  dbt_project.yml
  models/
  charts/          # boards, next to the models they read
    revenue.yml

# in CI, on every pull request
$ dbt parse && dct validate charts/
Breaks fail the pull request
Queries reach models through ref(), resolved from your
manifest, so a renamed model or a missing column fails the pull request
that introduced it, before dbt run rebuilds the warehouse.
See the impact before you rename
dct impact lists every board that reads a column, so you
know what a model change touches before you make it.
Setup and CLI
One authed CLI does it all, even onboarding.
dbtcharts.com is built on the open-source dbt Charts language and its CLI.
Boards are files your agent already edits, and onboarding is dct cloud
commands, so an agent with a terminal can do the whole setup, from sign-in
to inviting the team.
uv tool install dbt-charts
Make charts of this with dbt Charts. Start with: uv tool install dbt-charts && dct skills intro
Agents that arrive on their own read dbtcharts.com/llms.txt.
From install to a shared board
# sign in and create the organization
$ dct cloud login
$ dct cloud org create "Acme"

# connect the repo and the warehouse
$ dct cloud project connect --org acme
$ dct cloud connection create --type bigquery \
    --keyfile sa.json --set project=acme-gcp \
    --set dataset=analytics
$ dct cloud source map analytics acme-gcp
$ dct cloud project sync

# bring in the team
$ dct cloud member invite dana@acme.com
Underneath all of it
Nothing is locked in.
Your boards are plain files in your Git repo, in an open language under Apache 2.0. The same board renders on your laptop, in CI, and on dbtcharts.com, so leaving the platform never means rebuilding your dashboards.
Point it at your warehouse. Ask anything.
Start with the free workspace. Connect your warehouse and your dbt repo, then ask your first question.