Live preview
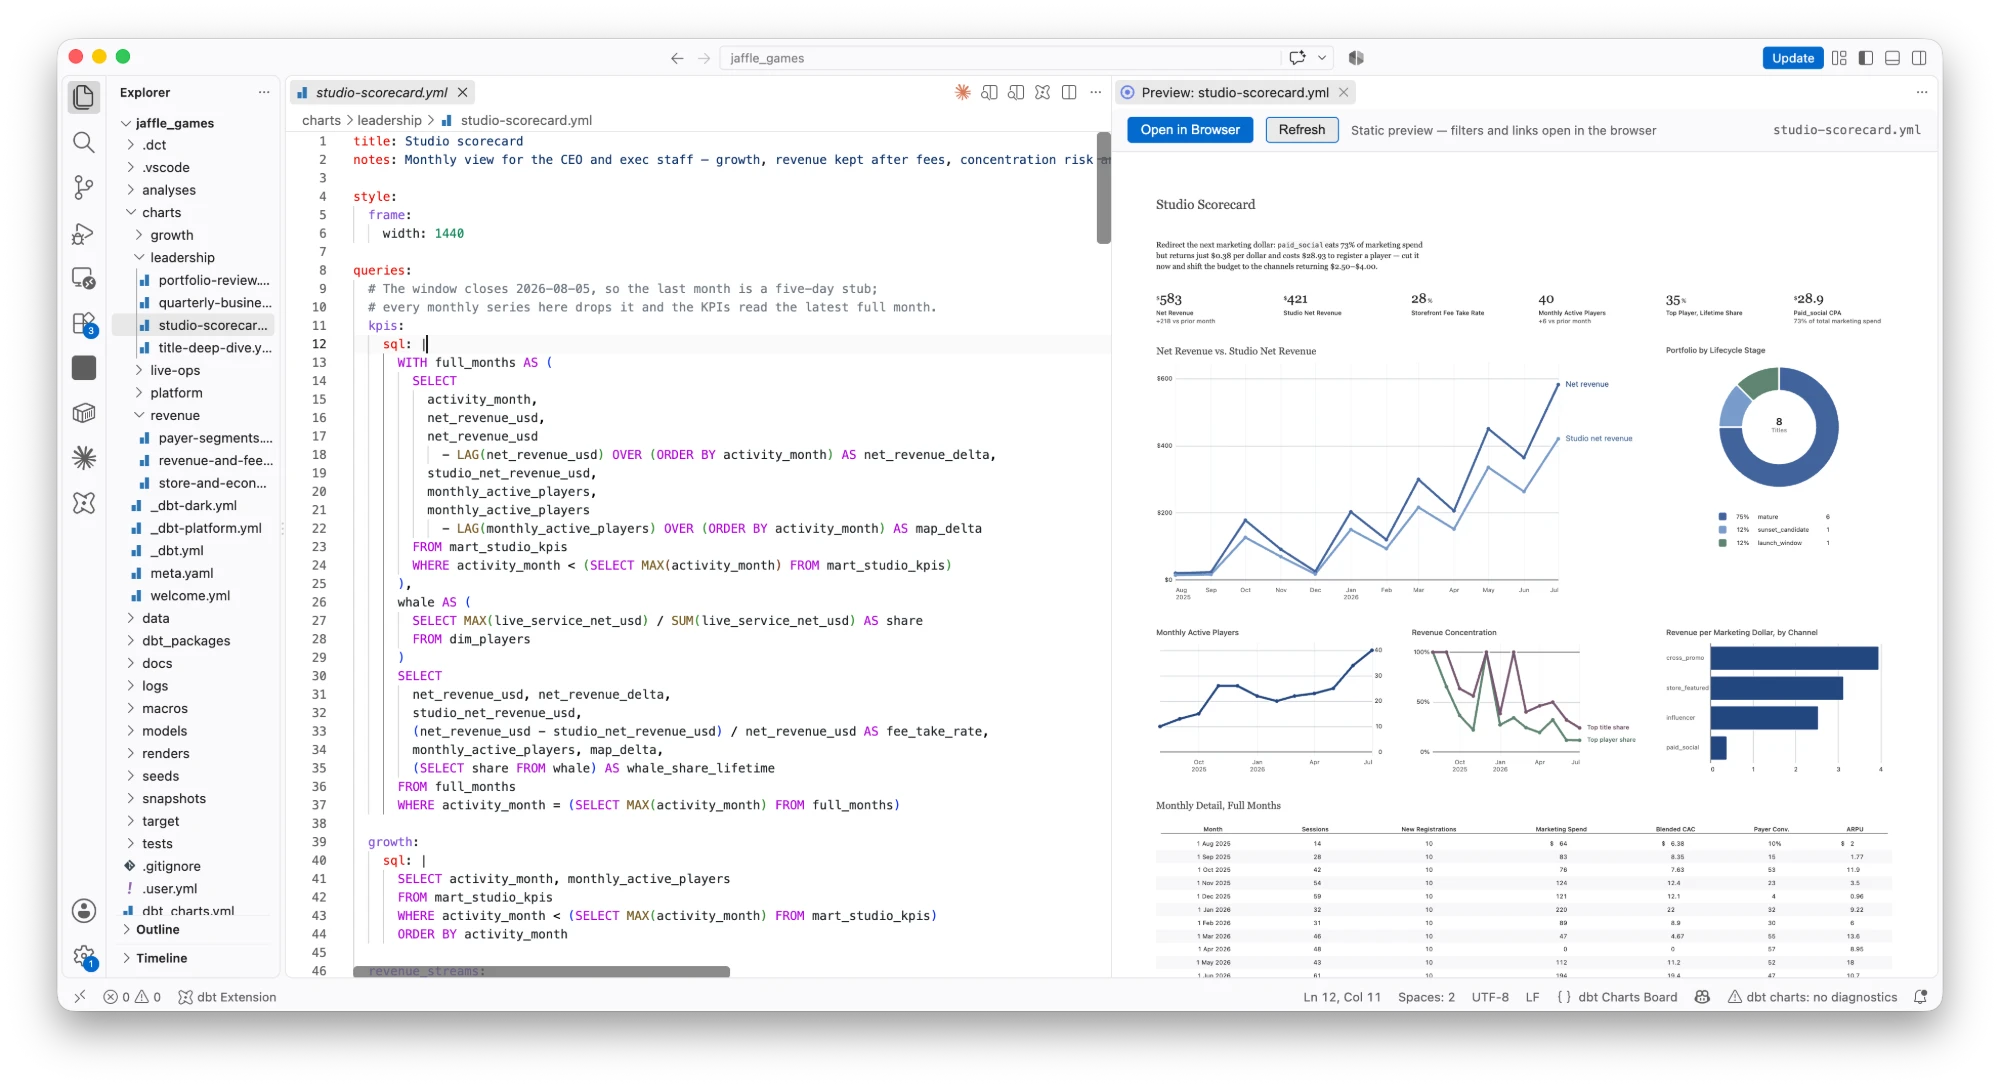
The rendered board opens beside the file and re-renders as you type, on the same sources the board uses in production. Click a chart to jump to its YAML.
VS Code and Cursor extension
Edit a board in VS Code or Cursor and watch it render next to the file, on real data. Highlighting, snippets, and the compiler's own errors come with it.
Free. Already in VS Code? Open it in the editor.
What it does
The rendered board opens beside the file and re-renders as you type, on the same sources the board uses in production. Click a chart to jump to its YAML.
Board YAML, plus the SQL and Jinja inside it. The grammar is generated from the schema the engine compiles against, so new chart types light up when you update the extension.
The language server checks against the real compiler, not a static schema. Each error links to its docs; hover explains chart and input types; Cmd+Click jumps to a query.
A working scaffold for every chart, variable, and layout type, and the real list of themes, chart types, and inputs as you type a value.
Render to HTML or PNG, or run a full validation, from the Command Palette. Every command calls the same CLI, so the output matches CI.
One command connects Cursor's or VS Code's assistant to the dbt Charts MCP server, so it can read your schema, run queries, and render boards.
Install
From the VS Code Marketplace, or Open VSX for Cursor and other VS Code forks. Or search for dbt Charts in the Extensions panel.
code --install-extension dbtLabsInc.dbtchartsThe preview, export, and validation run the dct CLI in your project.
Highlighting and snippets work without it.
uv tool install dbt-chartsOpen any board file and press Cmd+Shift+V, or Ctrl+Shift+V on Windows and Linux, to open the preview beside it.
Settings, commands, and troubleshooting are in the extension docs.
Free, in the editor you already use.