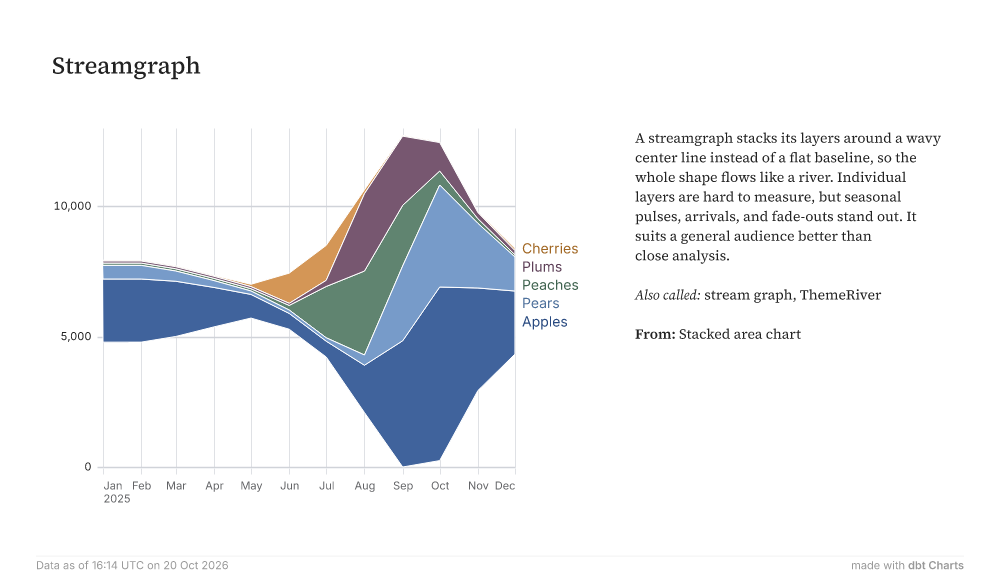
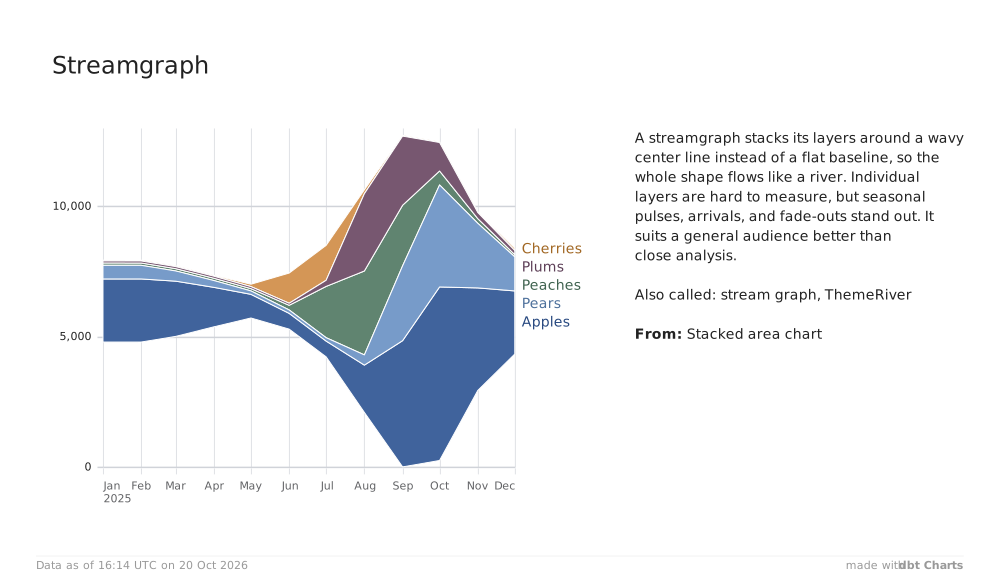
Streamgraph Jan2025FebMarAprMayJunJulAugSepOctNovDec05,00010,000CherriesPlumsPeachesPearsApples A streamgraph stacks its layers around a wavy center line instead of a flat baseline, so the whole shape flows like a river. Individual layers are hard to measure, but seasonal pulses, arrivals, and fade-outs stand out. It suits a general audience better than close analysis. Also called: stream graph, ThemeRiver From: Stacked area chart Data as of 16:14 UTC on 20 Oct 2026 made withdbt Charts