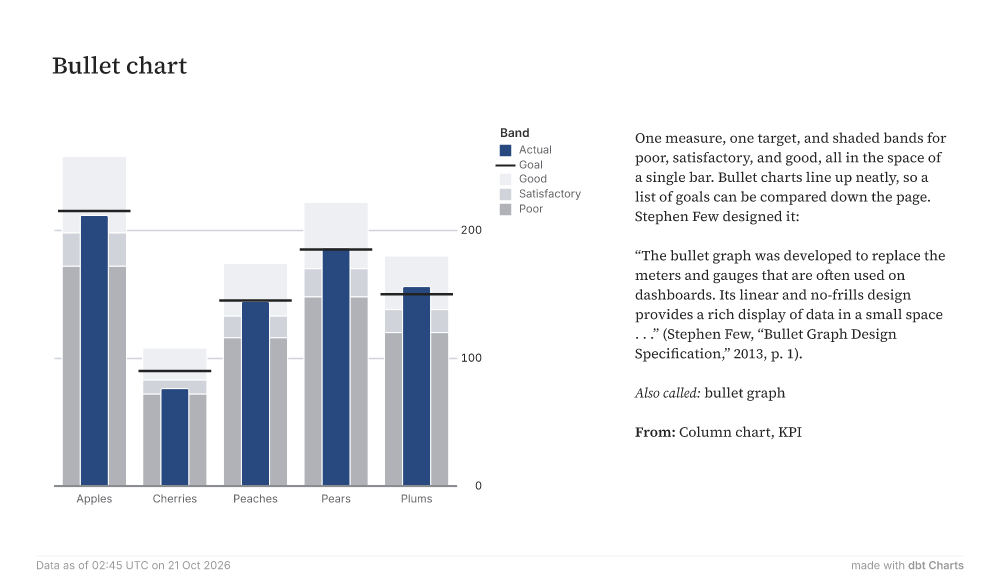
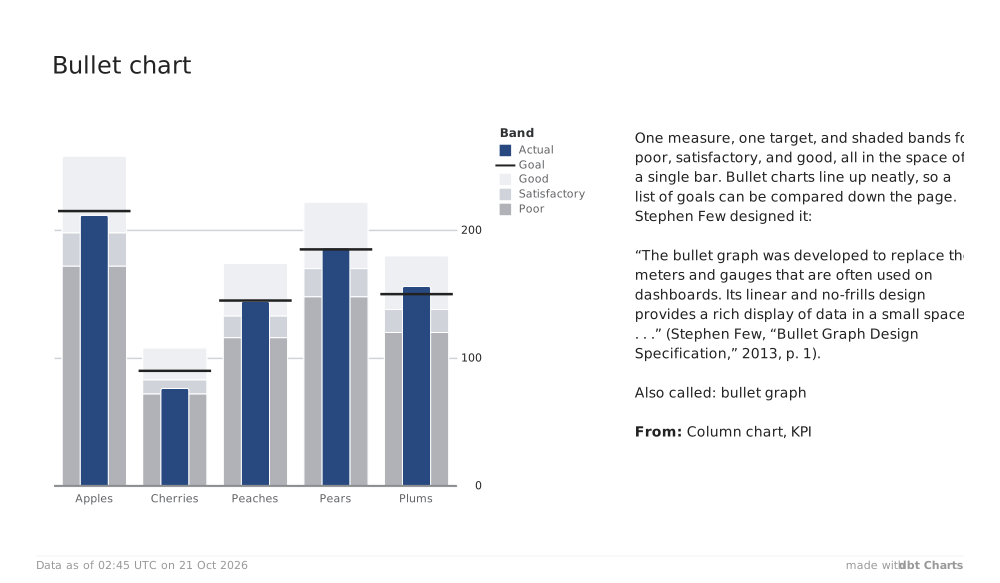
Bullet chart ApplesCherriesPeachesPearsPlums0100200ActualGoalGoodSatisfactoryPoorBand One measure, one target, and shaded bands for poor, satisfactory, and good, all in the space of a single bar. Bullet charts line up neatly, so a list of goals can be compared down the page. Stephen Few designed it: “The bullet graph was developed to replace the meters and gauges that are often used on dashboards. Its linear and no-frills design provides a rich display of data in a small space . . .” (Stephen Few, “Bullet Graph Design Specification,” 2013, p. 1). Also called: bullet graph From: Column chart, KPI Data as of 02:45 UTC on 21 Oct 2026 made withdbt Charts