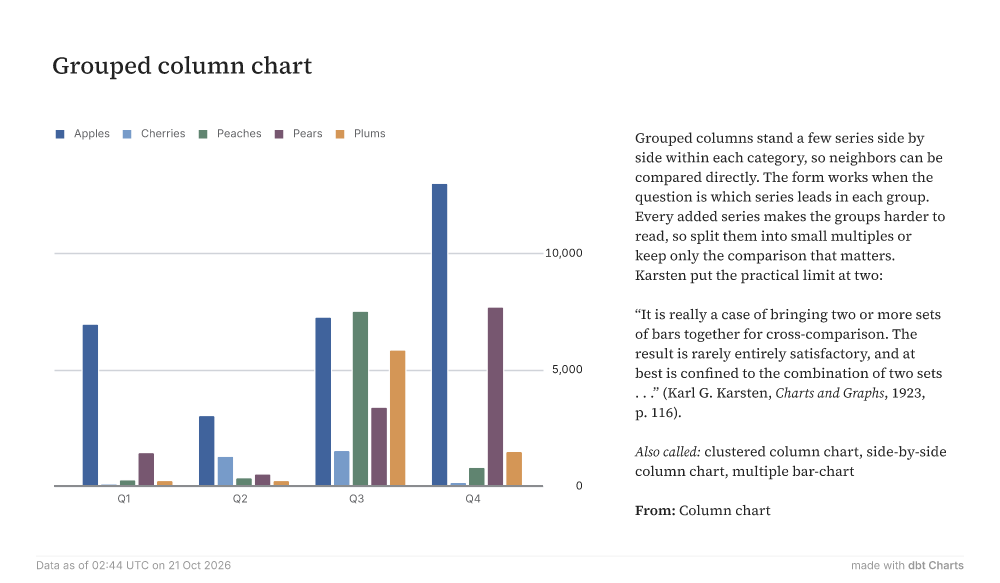
Grouped column chart Q1Q2Q3Q405,00010,000ApplesCherriesPeachesPearsPlums Grouped columns stand a few series side by side within each category, so neighbors can be compared directly. The form works when the question is which series leads in each group. Every added series makes the groups harder to read, so split them into small multiples or keep only the comparison that matters. Karsten put the practical limit at two: “It is really a case of bringing two or more sets of bars together for cross-comparison. The result is rarely entirely satisfactory, and at best is confined to the combination of two sets . . .” (Karl G. Karsten, Charts and Graphs, 1923, p. 116). Also called: clustered column chart, side-by-side column chart, multiple bar-chart From: Column chart Data as of 02:44 UTC on 21 Oct 2026 made withdbt Charts