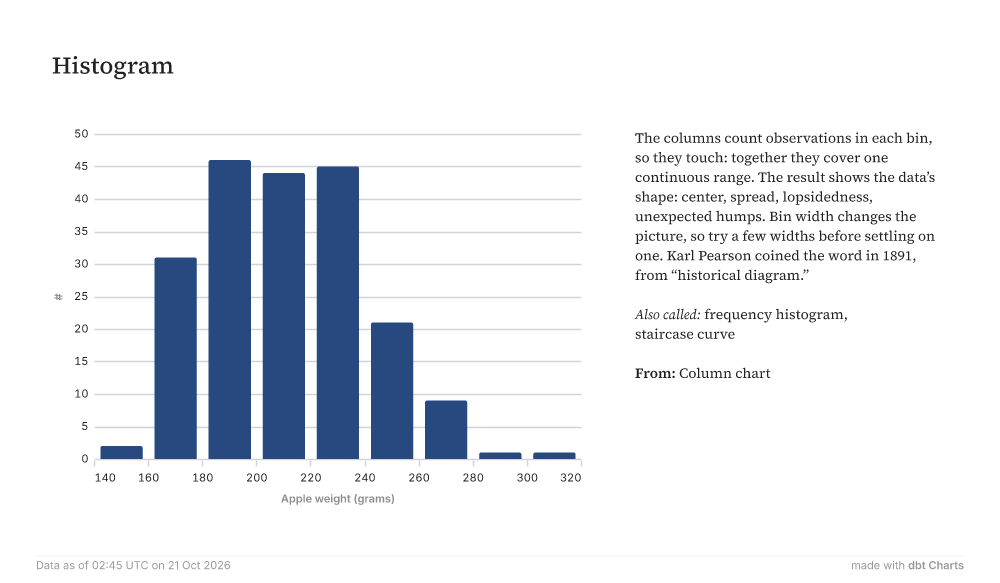
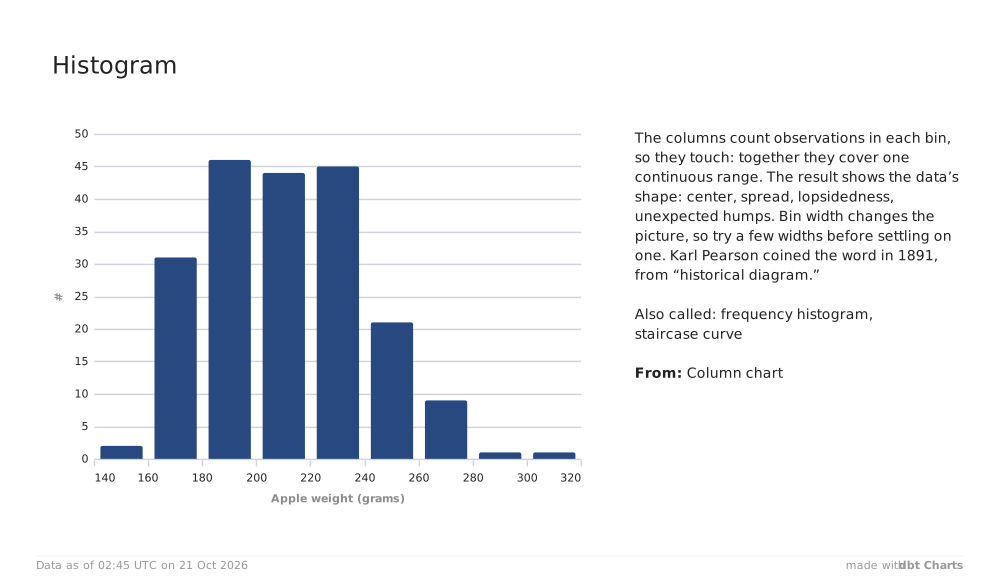
Histogram 140160180200220240260280300320Apple weight (grams)05101520253035404550# The columns count observations in each bin, so they touch: together they cover one continuous range. The result shows the data’s shape: center, spread, lopsidedness, unexpected humps. Bin width changes the picture, so try a few widths before settling on one. Karl Pearson coined the word in 1891, from “historical diagram.” Also called: frequency histogram, staircase curve From: Column chart Data as of 02:45 UTC on 21 Oct 2026 made withdbt Charts