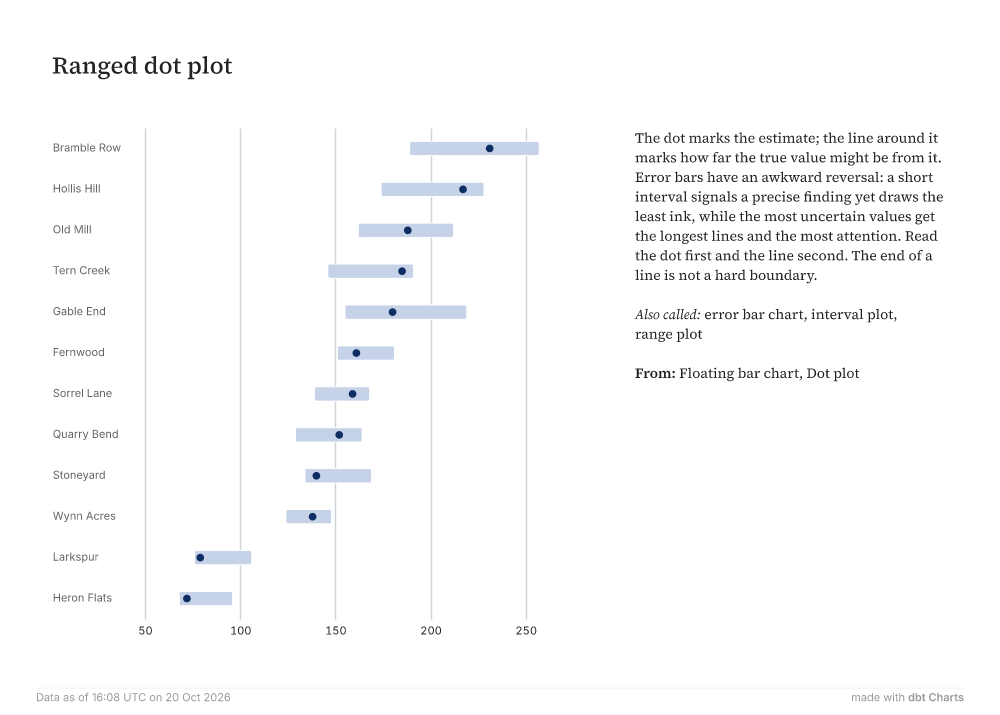
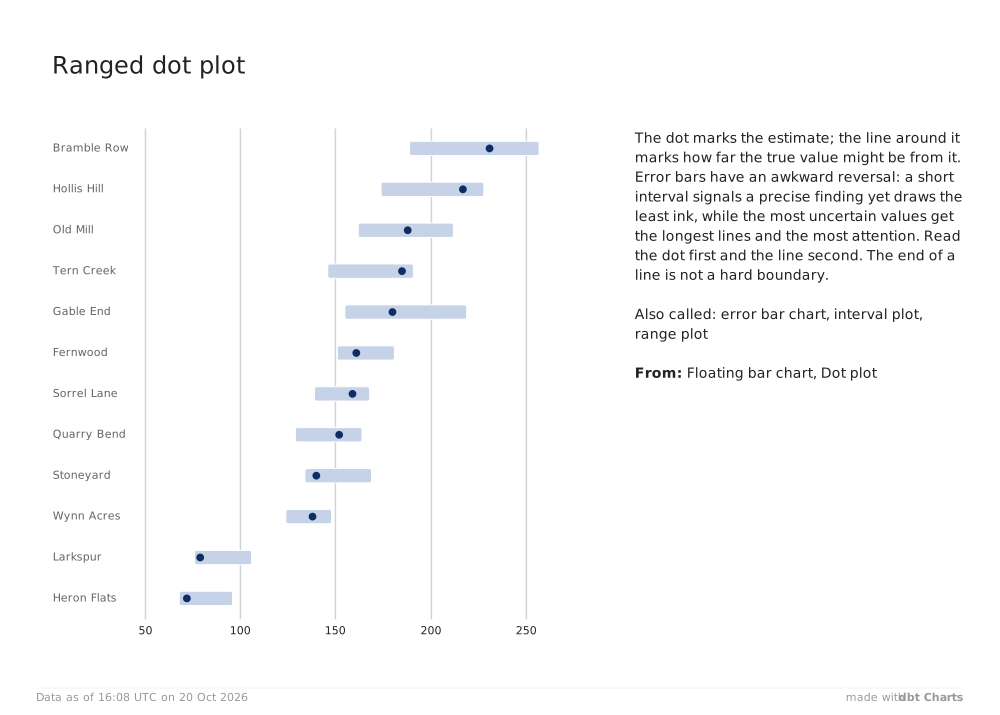
Ranged dot plot 50100150200250Bramble RowHollis HillOld MillTern CreekGable EndFernwoodSorrel LaneQuarry BendStoneyardWynn AcresLarkspurHeron Flats The dot marks the estimate; the line around it marks how far the true value might be from it. Error bars have an awkward reversal: a short interval signals a precise finding yet draws the least ink, while the most uncertain values get the longest lines and the most attention. Read the dot first and the line second. The end of a line is not a hard boundary. Also called: error bar chart, interval plot, range plot From: Floating bar chart, Dot plot Data as of 16:08 UTC on 20 Oct 2026 made withdbt Charts