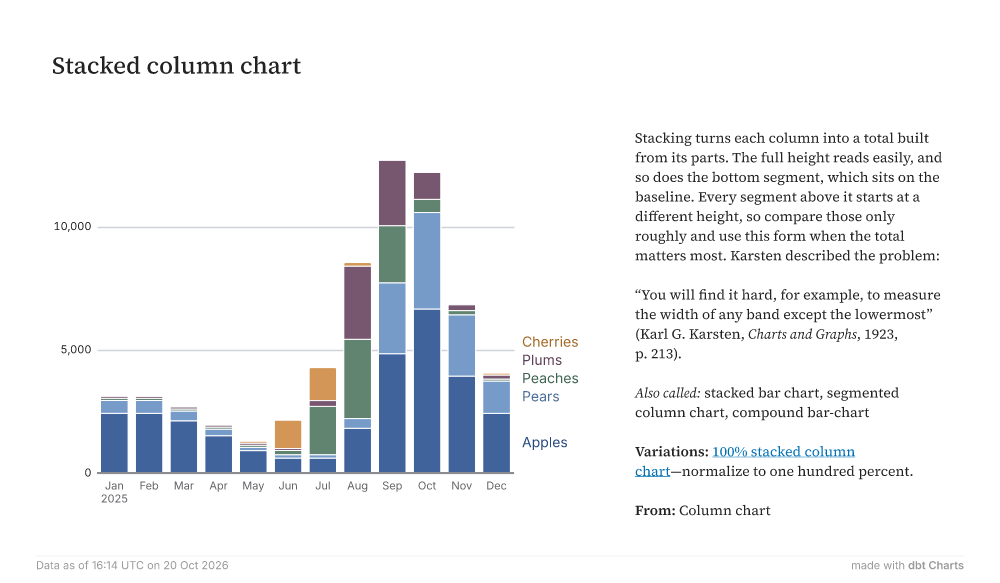
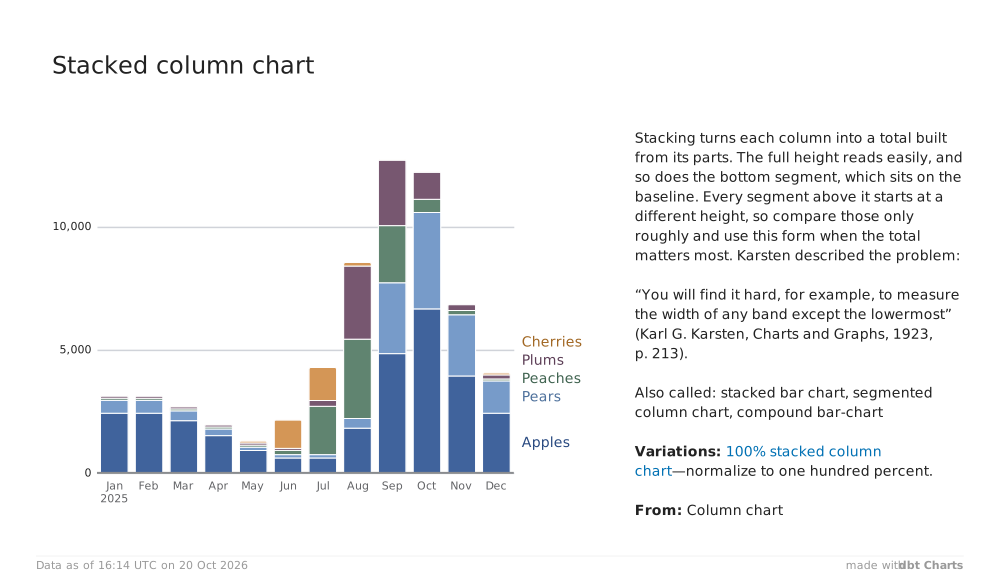
Stacked column chart Jan2025FebMarAprMayJunJulAugSepOctNovDec05,00010,000CherriesPlumsPeachesPearsApples Stacking turns each column into a total built from its parts. The full height reads easily, and so does the bottom segment, which sits on the baseline. Every segment above it starts at a different height, so compare those only roughly and use this form when the total matters most. Karsten described the problem: “You will find it hard, for example, to measure the width of any band except the lowermost” (Karl G. Karsten, Charts and Graphs, 1923, p. 213). Also called: stacked bar chart, segmented column chart, compound bar-chart Variations: 100% stacked column chart—normalize to one hundred percent. From: Column chart Data as of 16:14 UTC on 20 Oct 2026 made withdbt Charts