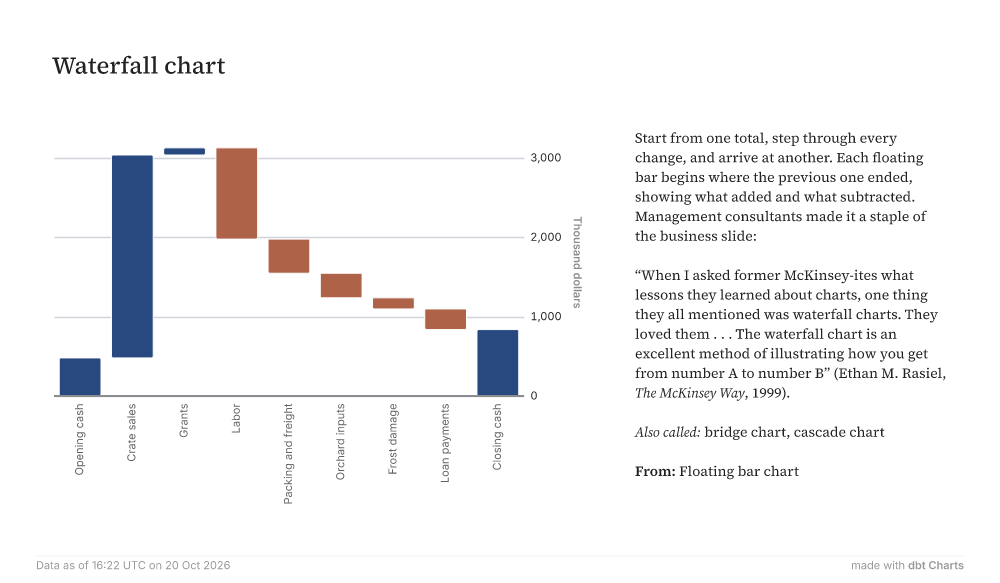
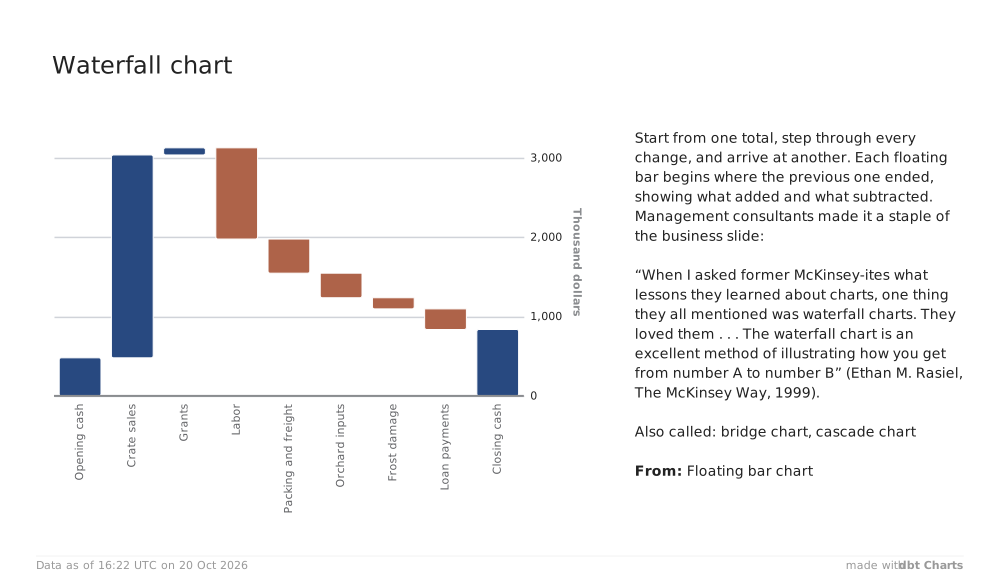
Waterfall chart Opening cashCrate salesGrantsLaborPacking and freightOrchard inputsFrost damageLoan paymentsClosing cash01,0002,0003,000Thousand dollars Start from one total, step through every change, and arrive at another. Each floating bar begins where the previous one ended, showing what added and what subtracted. Management consultants made it a staple of the business slide: “When I asked former McKinsey-ites what lessons they learned about charts, one thing they all mentioned was waterfall charts. They loved them . . . The waterfall chart is an excellent method of illustrating how you get from number A to number B” (Ethan M. Rasiel, The McKinsey Way, 1999). Also called: bridge chart, cascade chart From: Floating bar chart Data as of 16:22 UTC on 20 Oct 2026 made withdbt Charts