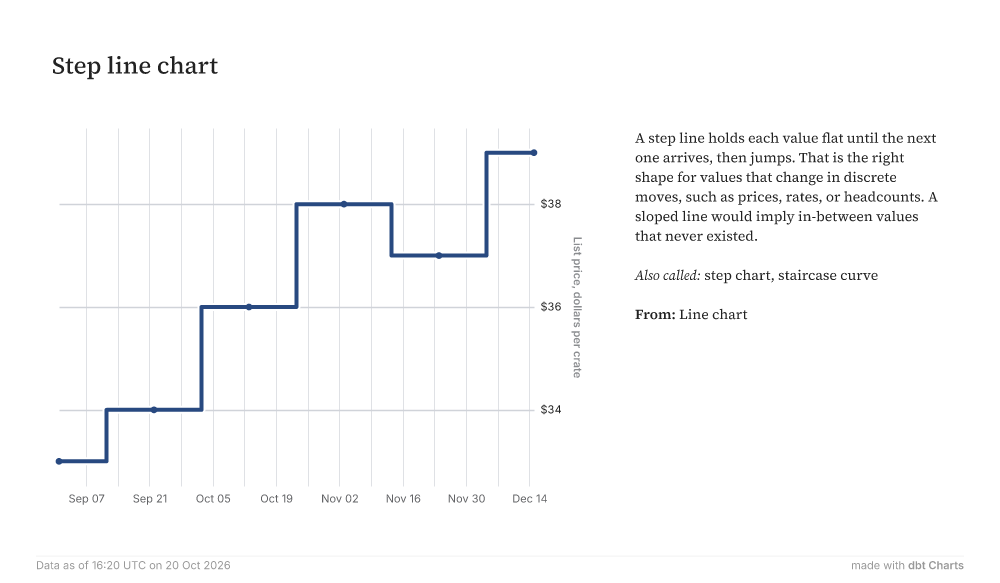
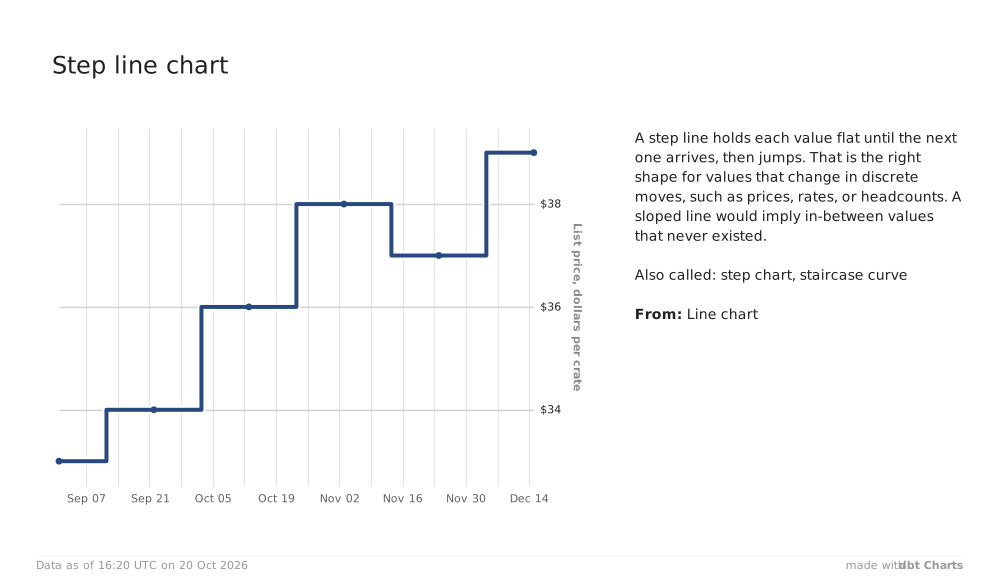
Step line chart Sep 07Sep 14Sep 21Sep 28Oct 05Oct 12Oct 19Oct 26Nov 02Nov 09Nov 16Nov 23Nov 30Dec 07Dec 14$34$36$38List price, dollars per crate A step line holds each value flat until the next one arrives, then jumps. That is the right shape for values that change in discrete moves, such as prices, rates, or headcounts. A sloped line would imply in-between values that never existed. Also called: step chart, staircase curve From: Line chart Data as of 16:20 UTC on 20 Oct 2026 made withdbt Charts