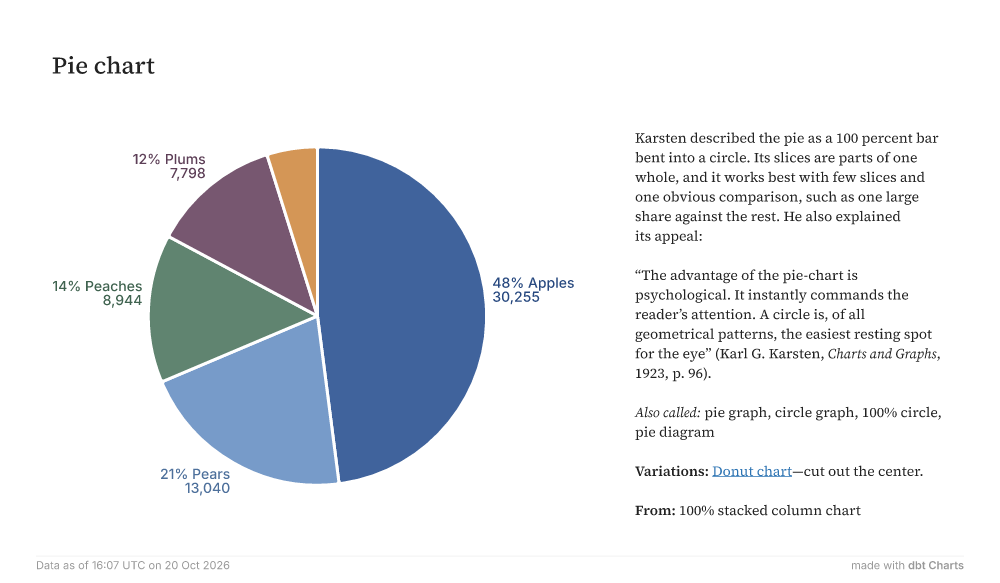
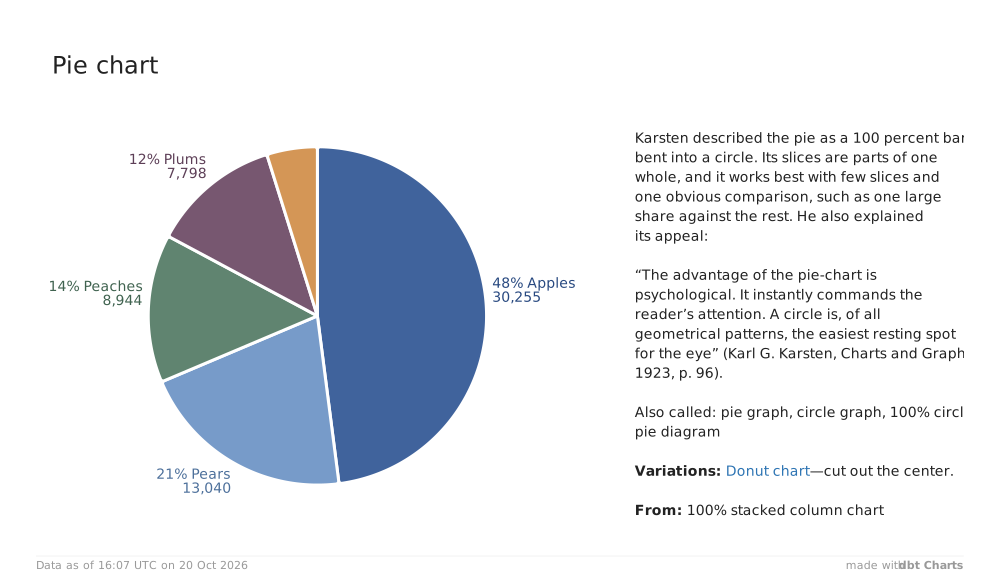
Pie chart 48% Apples30,25521% Pears13,04014% Peaches8,94412% Plums7,798 Karsten described the pie as a 100 percent bar bent into a circle. Its slices are parts of one whole, and it works best with few slices and one obvious comparison, such as one large share against the rest. He also explained its appeal: “The advantage of the pie-chart is psychological. It instantly commands the reader’s attention. A circle is, of all geometrical patterns, the easiest resting spot for the eye” (Karl G. Karsten, Charts and Graphs, 1923, p. 96). Also called: pie graph, circle graph, 100% circle, pie diagram Variations: Donut chart—cut out the center. From: 100% stacked column chart Data as of 16:07 UTC on 20 Oct 2026 made withdbt Charts