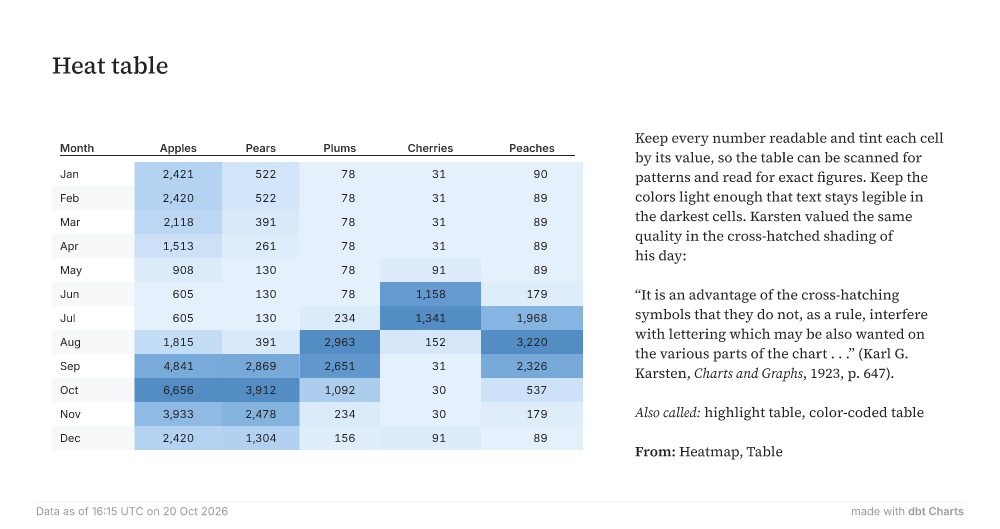
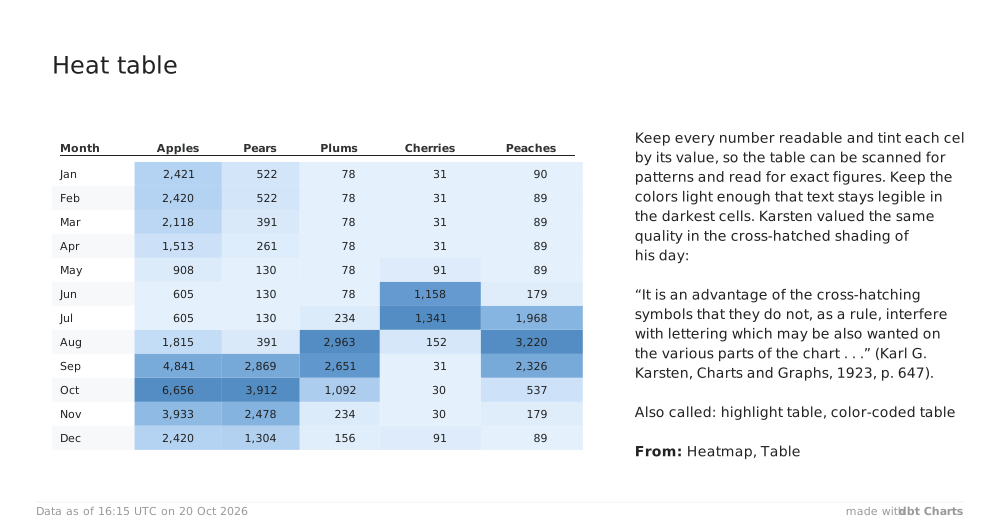
Heat table MonthApplesPearsPlumsCherriesPeachesJan2,421522783190Feb2,420522783189Mar2,118391783189Apr1,513261783189May908130789189Jun605130781,158179Jul6051302341,3411,968Aug1,8153912,9631523,220Sep4,8412,8692,651312,326Oct6,6563,9121,09230537Nov3,9332,47823430179Dec2,4201,3041569189 Keep every number readable and tint each cell by its value, so the table can be scanned for patterns and read for exact figures. Keep the colors light enough that text stays legible in the darkest cells. Karsten valued the same quality in the cross-hatched shading of his day: “It is an advantage of the cross-hatching symbols that they do not, as a rule, interfere with lettering which may be also wanted on the various parts of the chart . . .” (Karl G. Karsten, Charts and Graphs, 1923, p. 647). Also called: highlight table, color-coded table From: Heatmap, Table Data as of 16:15 UTC on 20 Oct 2026 made withdbt Charts