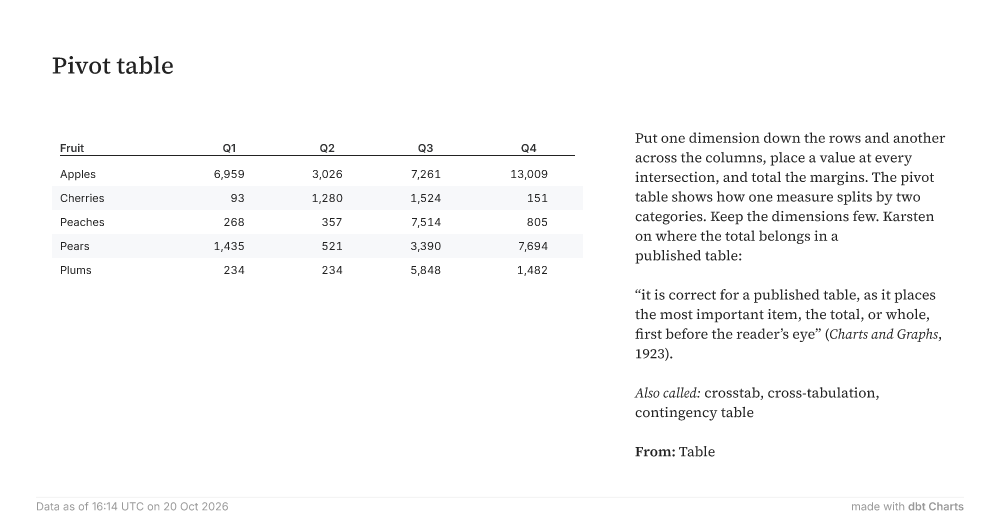
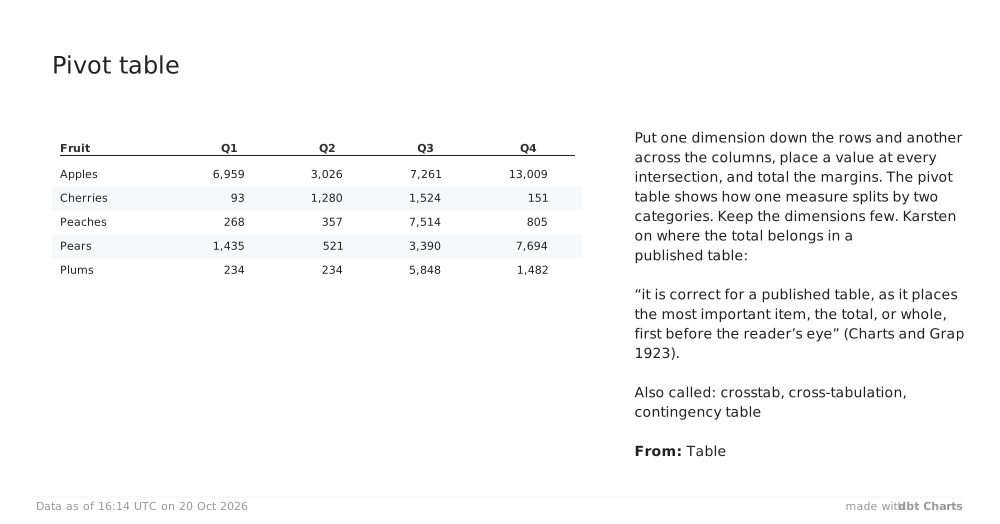
Pivot table FruitQ1Q2Q3Q4Apples6,9593,0267,26113,009Cherries931,2801,524151Peaches2683577,514805Pears1,4355213,3907,694Plums2342345,8481,482 Put one dimension down the rows and another across the columns, place a value at every intersection, and total the margins. The pivot table shows how one measure splits by two categories. Keep the dimensions few. Karsten on where the total belongs in a published table: “it is correct for a published table, as it places the most important item, the total, or whole, first before the reader’s eye” (Charts and Graphs, 1923). Also called: crosstab, cross-tabulation, contingency table From: Table Data as of 16:14 UTC on 20 Oct 2026 made withdbt Charts