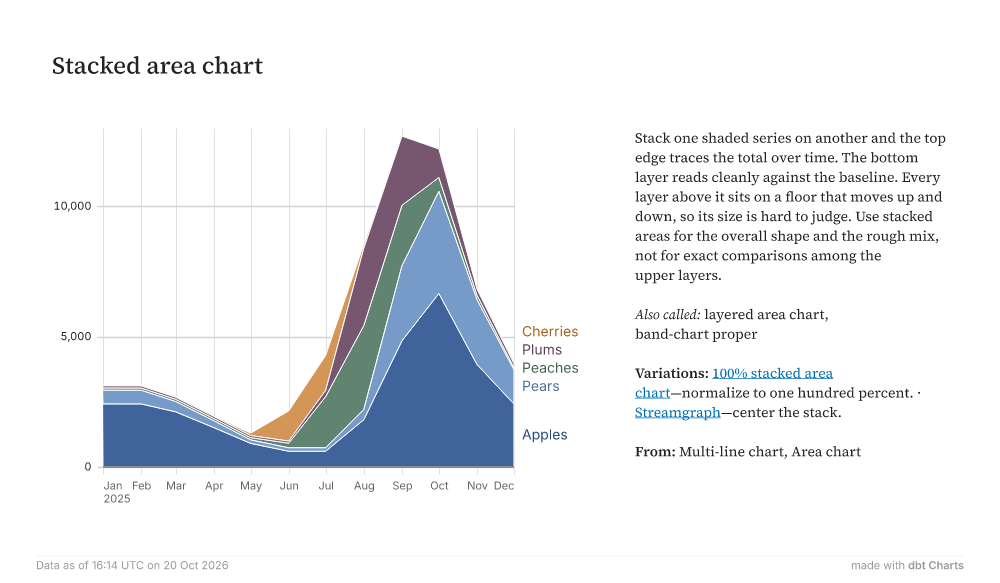
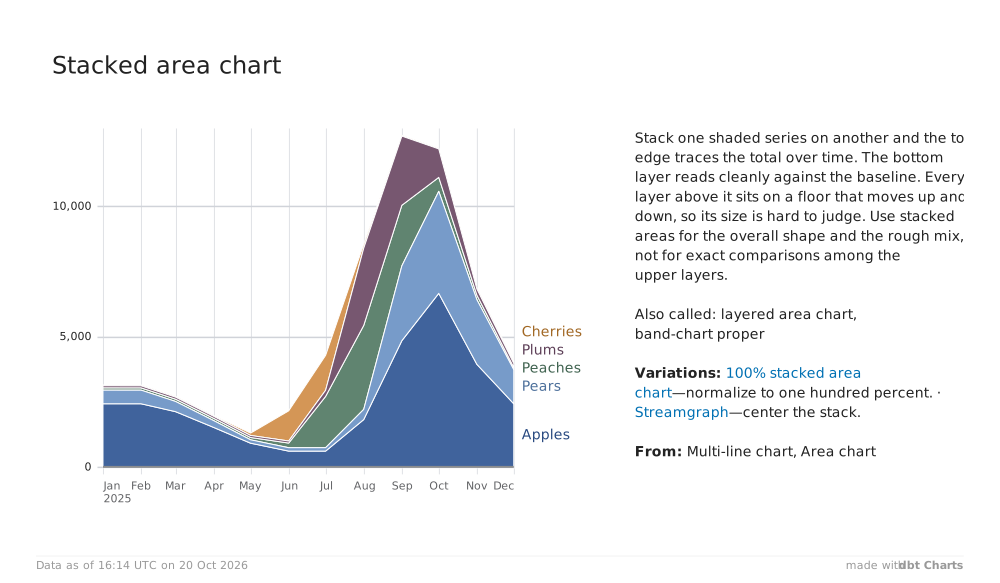
Stacked area chart Jan2025FebMarAprMayJunJulAugSepOctNovDec05,00010,000CherriesPlumsPeachesPearsApples Stack one shaded series on another and the top edge traces the total over time. The bottom layer reads cleanly against the baseline. Every layer above it sits on a floor that moves up and down, so its size is hard to judge. Use stacked areas for the overall shape and the rough mix, not for exact comparisons among the upper layers. Also called: layered area chart, band-chart proper Variations: 100% stacked area chart—normalize to one hundred percent. · Streamgraph—center the stack. From: Multi-line chart, Area chart Data as of 16:14 UTC on 20 Oct 2026 made withdbt Charts