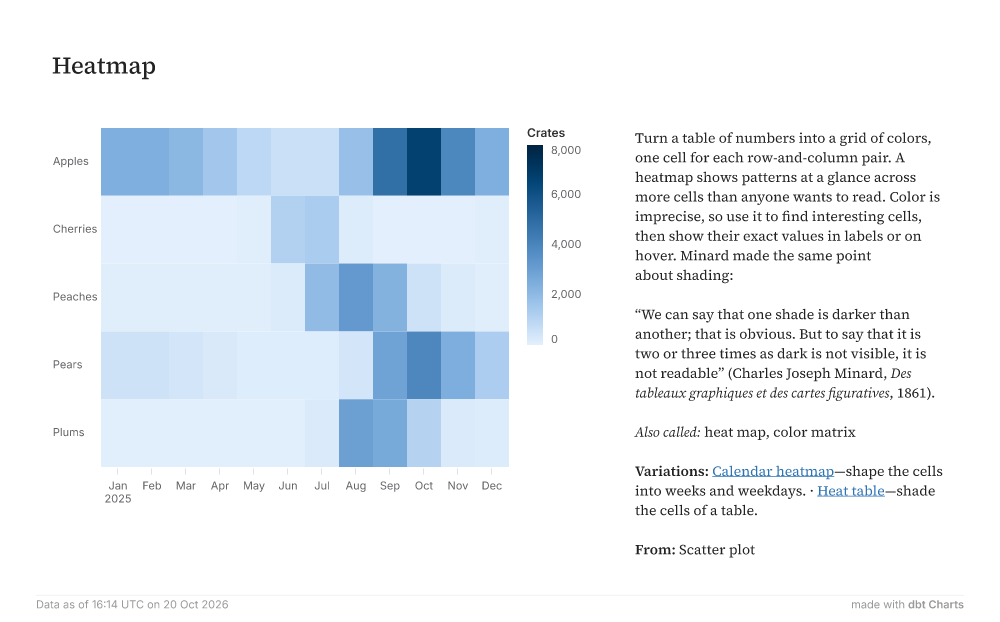
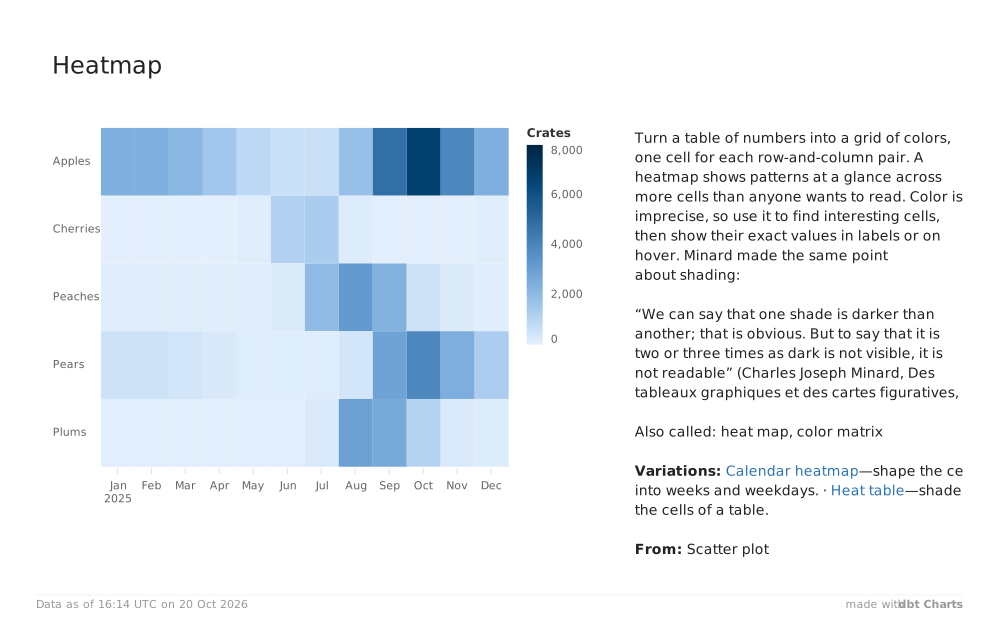
Heatmap 02,0004,0006,0008,000CratesJan2025FebMarAprMayJunJulAugSepOctNovDecApplesCherriesPeachesPearsPlums Turn a table of numbers into a grid of colors, one cell for each row-and-column pair. A heatmap shows patterns at a glance across more cells than anyone wants to read. Color is imprecise, so use it to find interesting cells, then show their exact values in labels or on hover. Minard made the same point about shading: “We can say that one shade is darker than another; that is obvious. But to say that it is two or three times as dark is not visible, it is not readable” (Charles Joseph Minard, Des tableaux graphiques et des cartes figuratives, 1861). Also called: heat map, color matrix Variations: Calendar heatmap—shape the cells into weeks and weekdays. · Heat table—shade the cells of a table. From: Scatter plot Data as of 16:14 UTC on 20 Oct 2026 made withdbt Charts