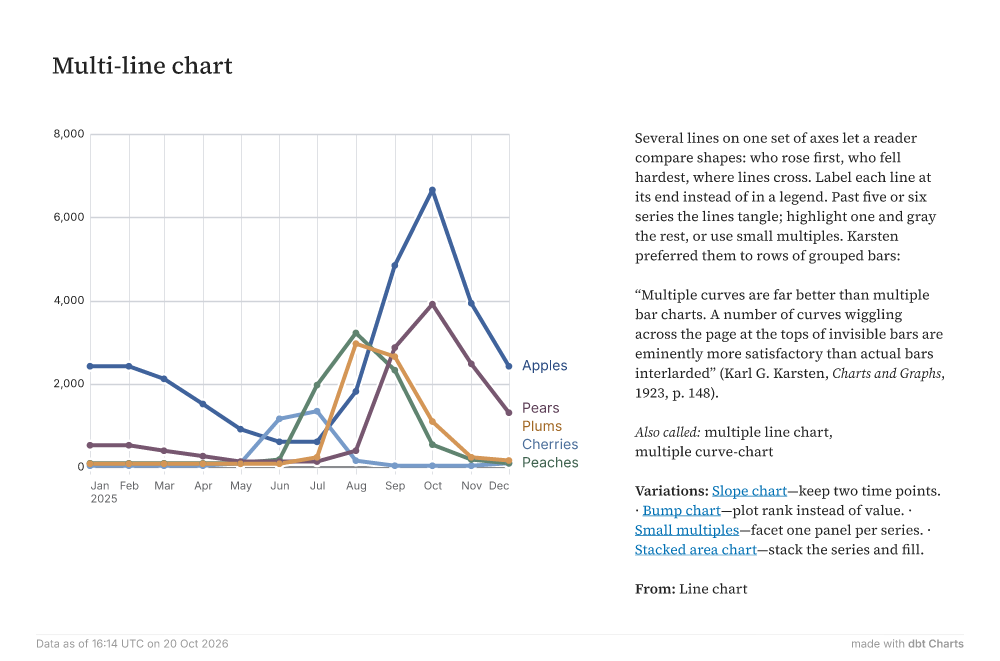
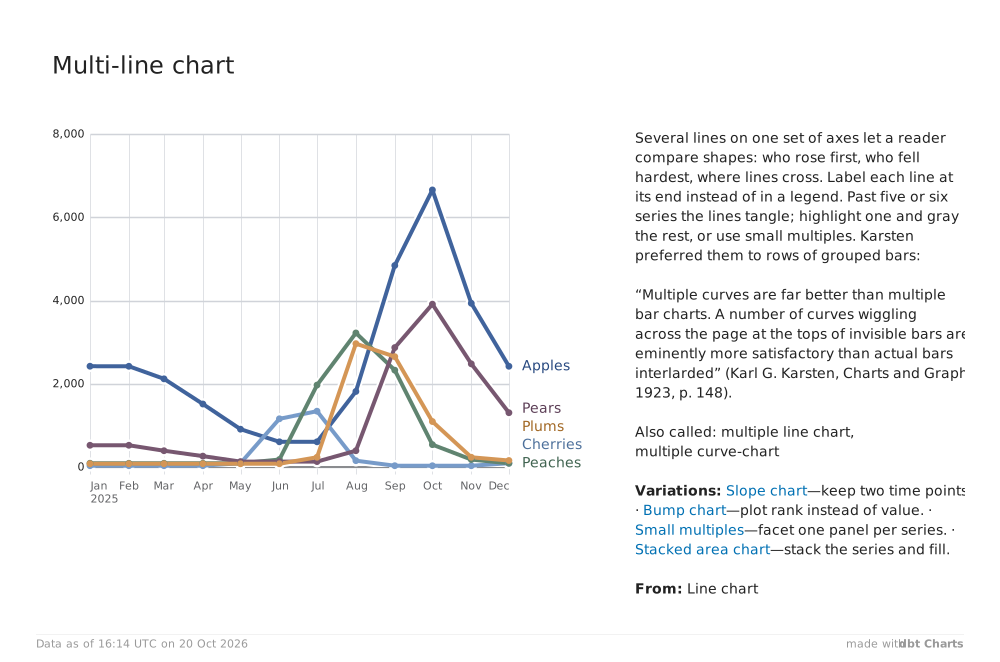
Multi-line chart Jan2025FebMarAprMayJunJulAugSepOctNovDec02,0004,0006,0008,000ApplesPearsPlumsCherriesPeaches Several lines on one set of axes let a reader compare shapes: who rose first, who fell hardest, where lines cross. Label each line at its end instead of in a legend. Past five or six series the lines tangle; highlight one and gray the rest, or use small multiples. Karsten preferred them to rows of grouped bars: “Multiple curves are far better than multiple bar charts. A number of curves wiggling across the page at the tops of invisible bars are eminently more satisfactory than actual bars interlarded” (Karl G. Karsten, Charts and Graphs, 1923, p. 148). Also called: multiple line chart, multiple curve-chart Variations: Slope chart—keep two time points. · Bump chart—plot rank instead of value. · Small multiples—facet one panel per series. · Stacked area chart—stack the series and fill. From: Line chart Data as of 16:14 UTC on 20 Oct 2026 made withdbt Charts