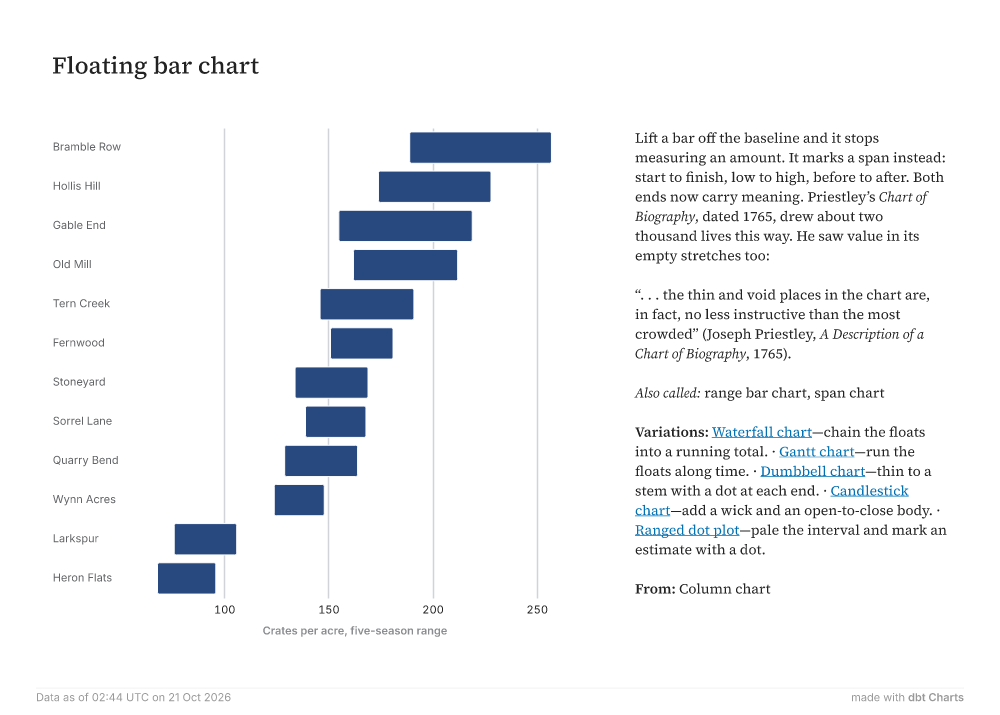
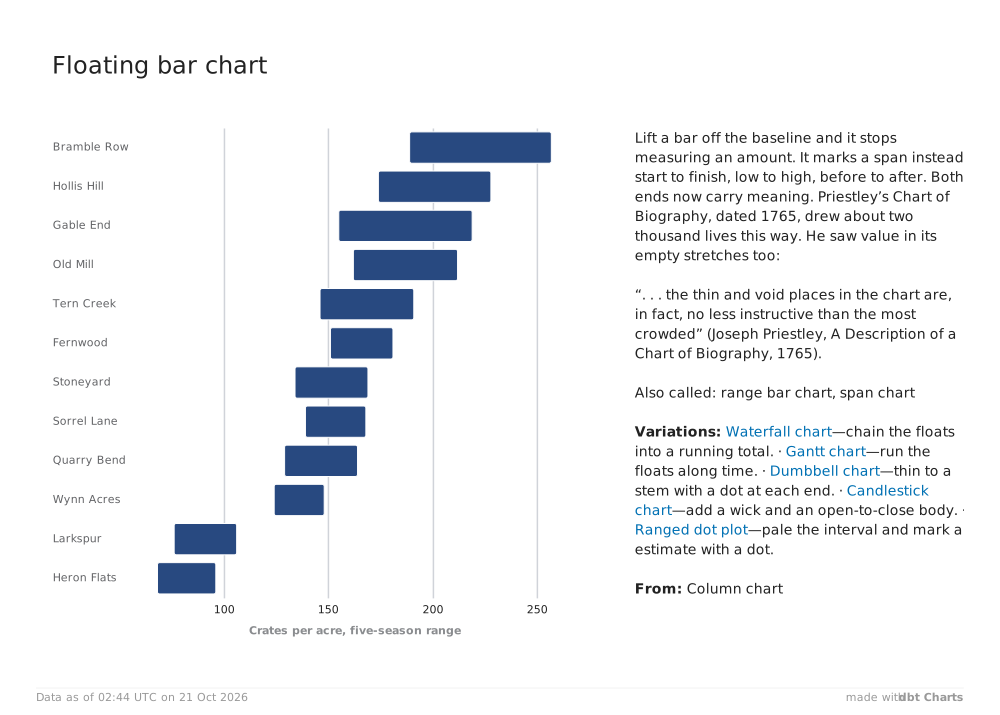
Floating bar chart 100150200250Crates per acre, five-season rangeBramble RowHollis HillGable EndOld MillTern CreekFernwoodStoneyardSorrel LaneQuarry BendWynn AcresLarkspurHeron Flats Lift a bar off the baseline and it stops measuring an amount. It marks a span instead: start to finish, low to high, before to after. Both ends now carry meaning. Priestley’s Chart of Biography, dated 1765, drew about two thousand lives this way. He saw value in its empty stretches too: “. . . the thin and void places in the chart are, in fact, no less instructive than the most crowded” (Joseph Priestley, A Description of a Chart of Biography, 1765). Also called: range bar chart, span chart Variations: Waterfall chart—chain the floats into a running total. · Gantt chart—run the floats along time. · Dumbbell chart—thin to a stem with a dot at each end. · Candlestick chart—add a wick and an open-to-close body. · Ranged dot plot—pale the interval and mark an estimate with a dot. From: Column chart Data as of 02:44 UTC on 21 Oct 2026 made withdbt Charts