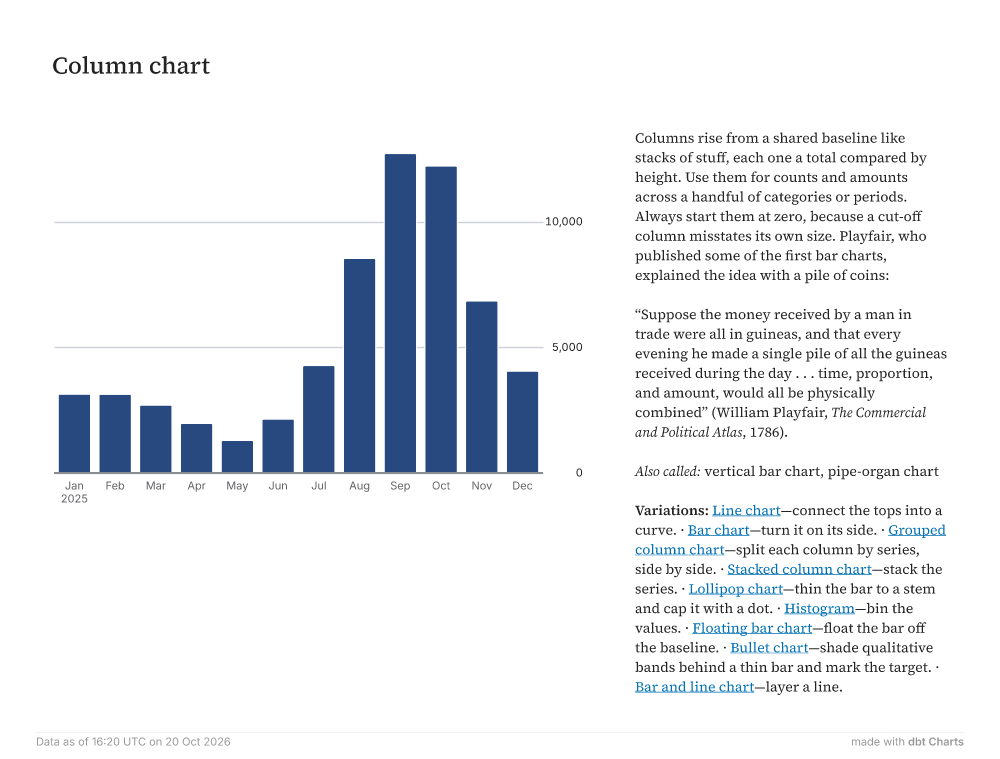
Column chart Jan2025FebMarAprMayJunJulAugSepOctNovDec05,00010,000 Columns rise from a shared baseline like stacks of stuff, each one a total compared by height. Use them for counts and amounts across a handful of categories or periods. Always start them at zero, because a cut-off column misstates its own size. Playfair, who published some of the first bar charts, explained the idea with a pile of coins: “Suppose the money received by a man in trade were all in guineas, and that every evening he made a single pile of all the guineas received during the day . . . time, proportion, and amount, would all be physically combined” (William Playfair, The Commercial and Political Atlas, 1786). Also called: vertical bar chart, pipe-organ chart Variations: Line chart—connect the tops into a curve. · Bar chart—turn it on its side. · Grouped column chart—split each column by series, side by side. · Stacked column chart—stack the series. · Lollipop chart—thin the bar to a stem and cap it with a dot. · Histogram—bin the values. · Floating bar chart—float the bar off the baseline. · Bullet chart—shade qualitative bands behind a thin bar and mark the target. · Bar and line chart—layer a line. Data as of 16:20 UTC on 20 Oct 2026 made withdbt Charts