Drag or use the arrow keys to move. Scroll, double-click, or press plus and minus to zoom. Press 0 to fit.
area · 5
bar · 16
grid · 2
line · 6
point · 3
radial · 2
table · 7
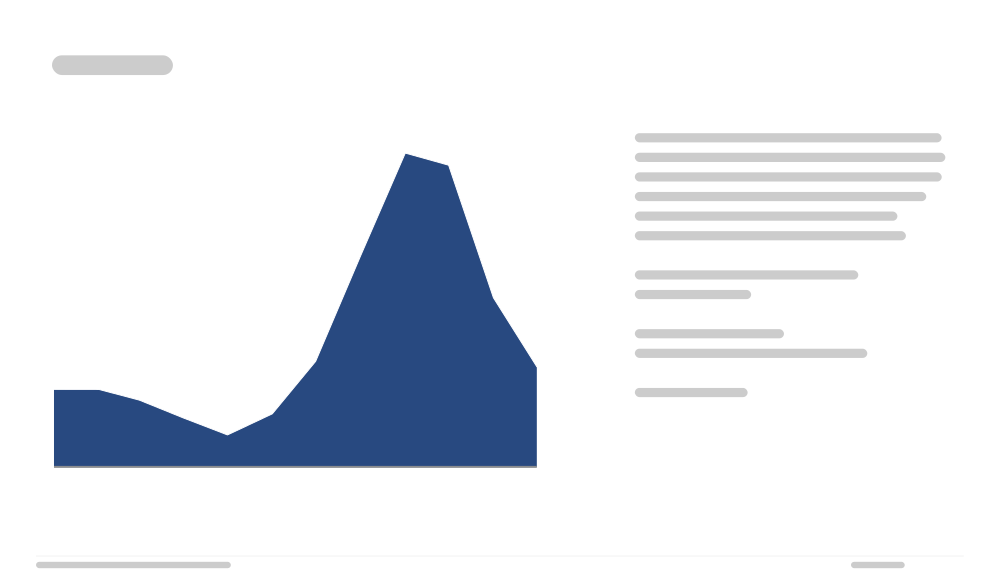
Area Chart
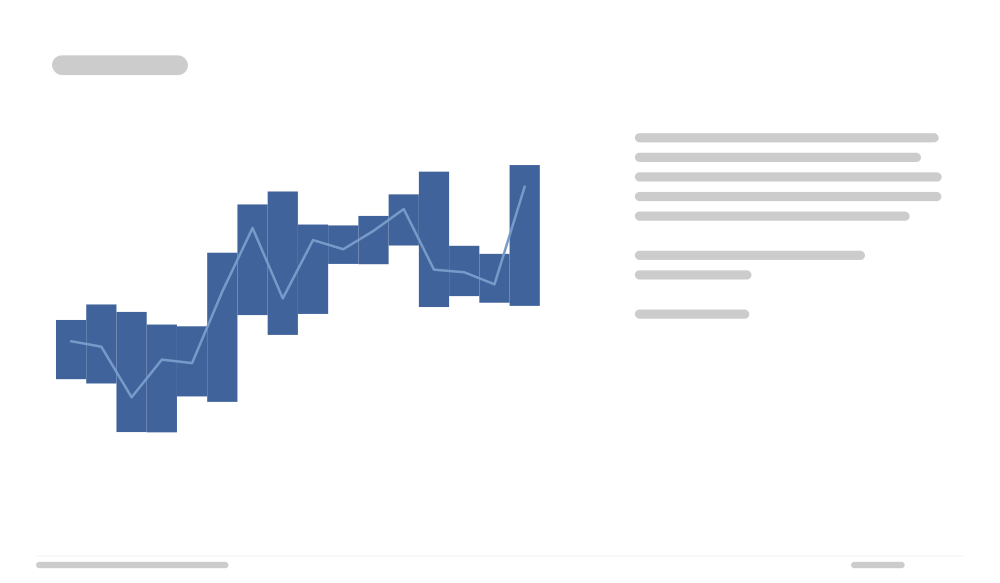
Range Band
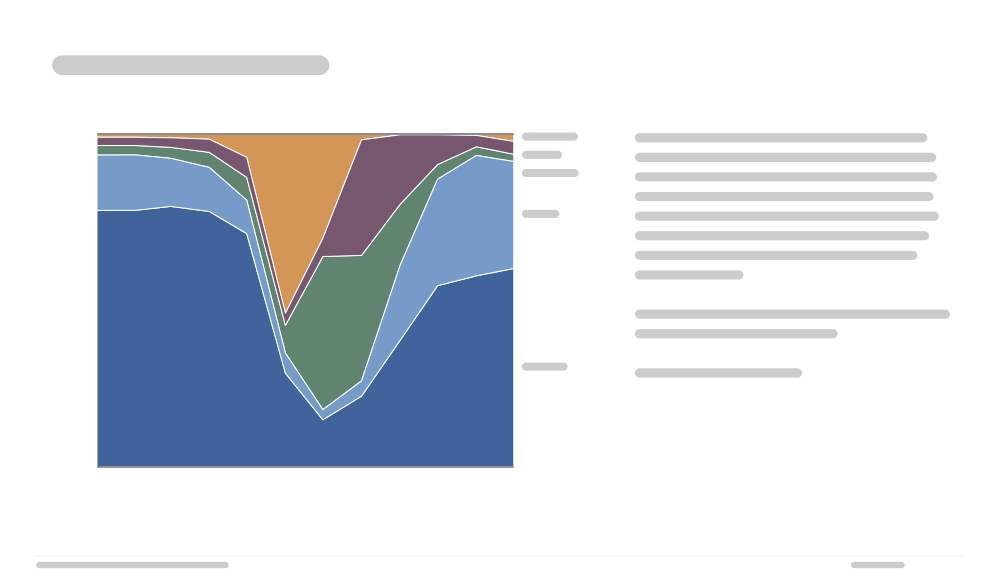
100% Stacked Area Chart
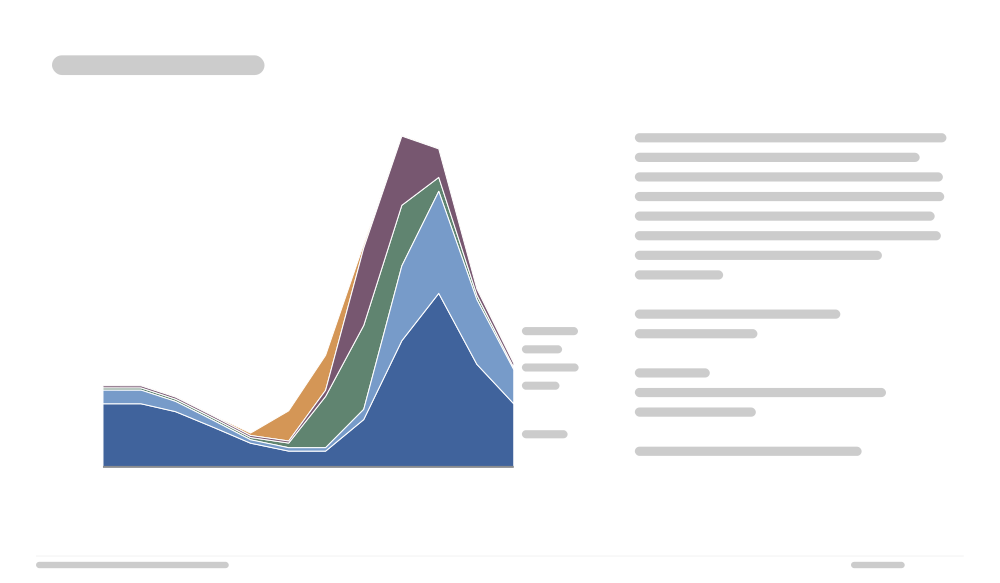
Stacked Area Chart
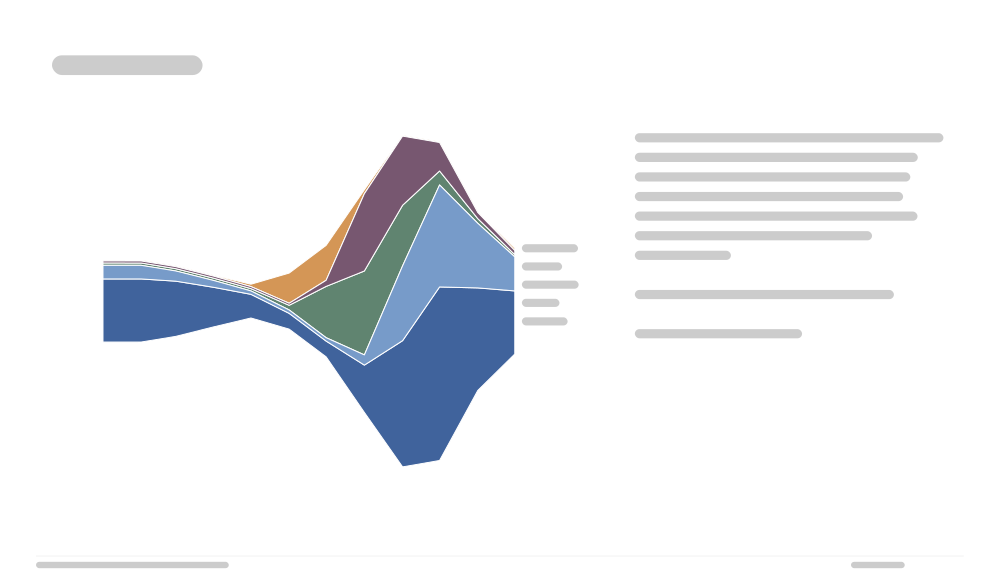
Streamgraph
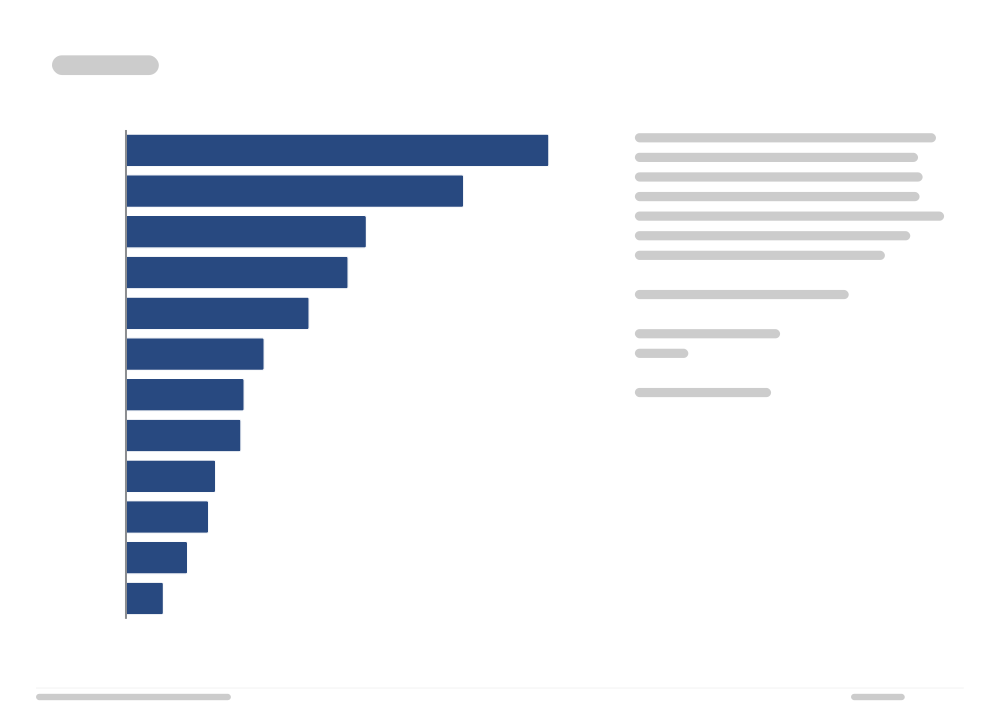
Bar Chart
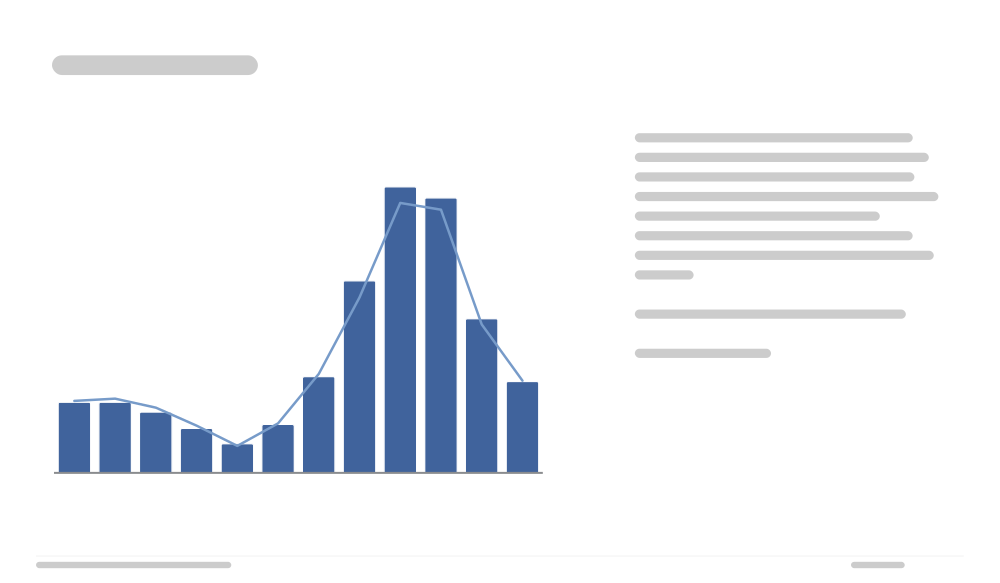
Bar and Line Chart
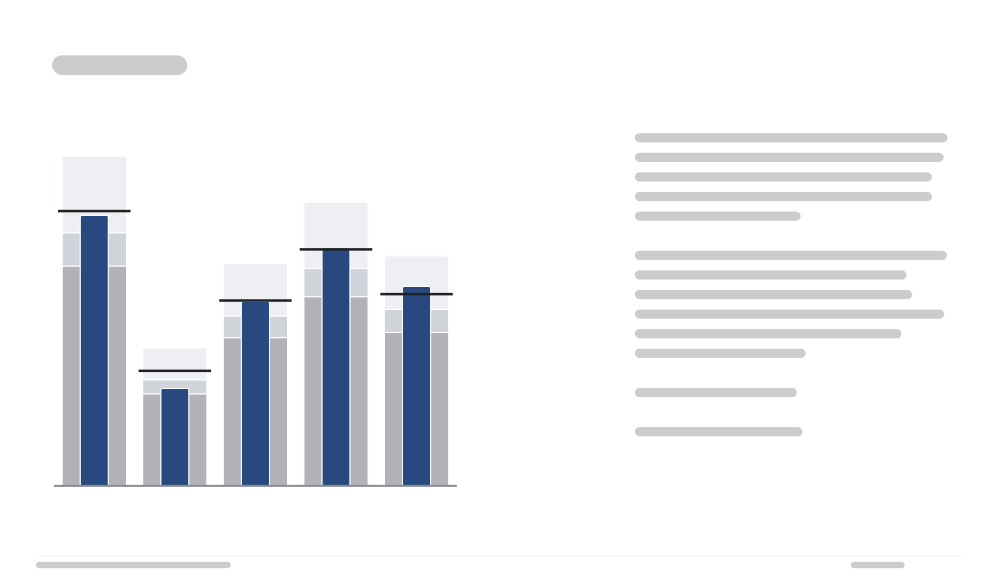
Bullet Chart
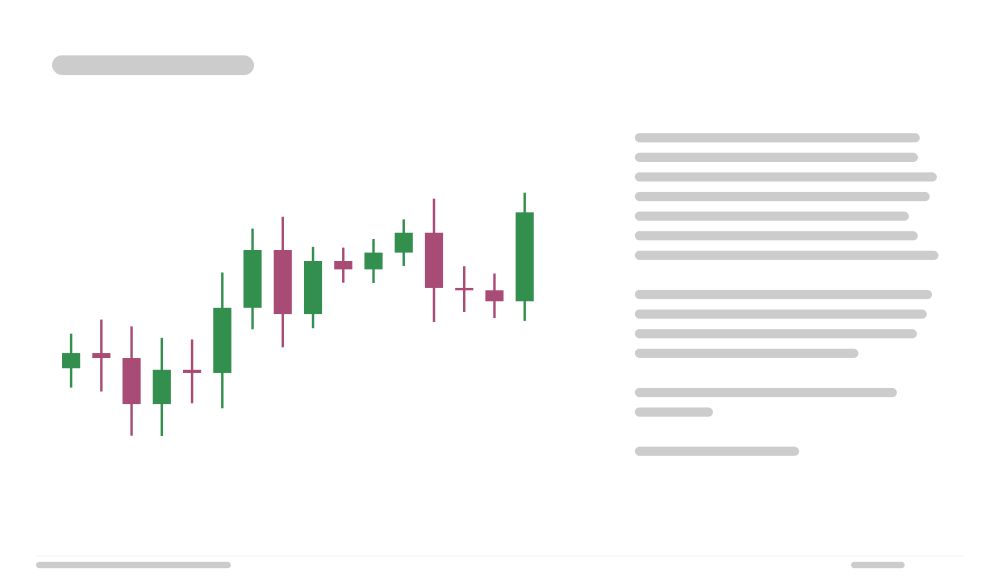
Candlestick Chart
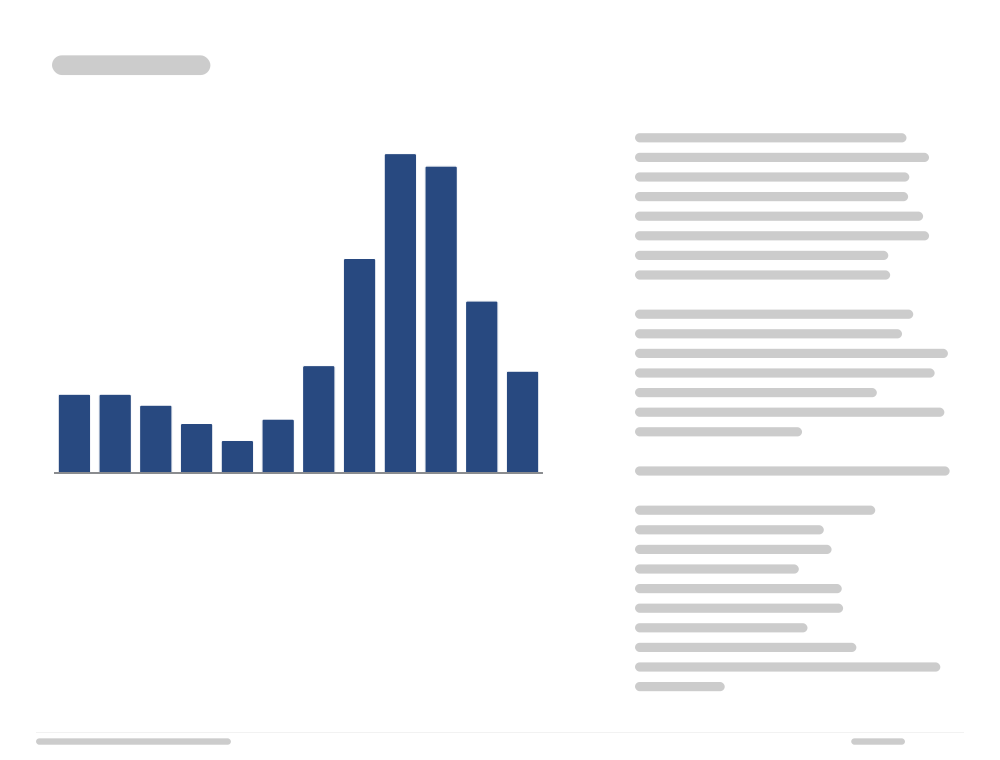
Column Chart
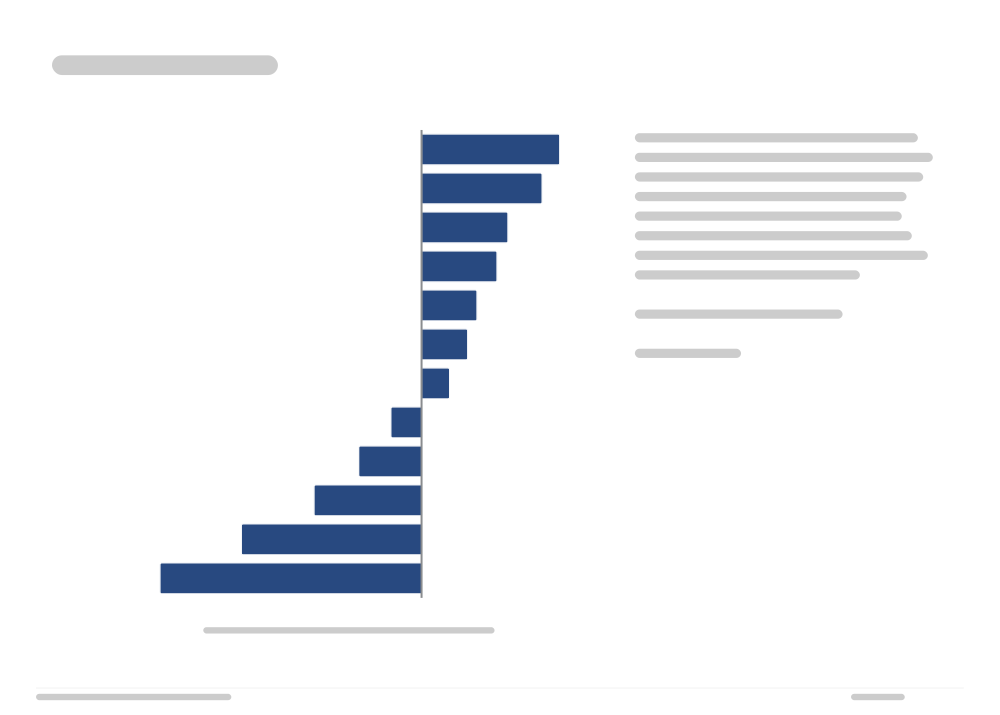
Diverging Bar Chart
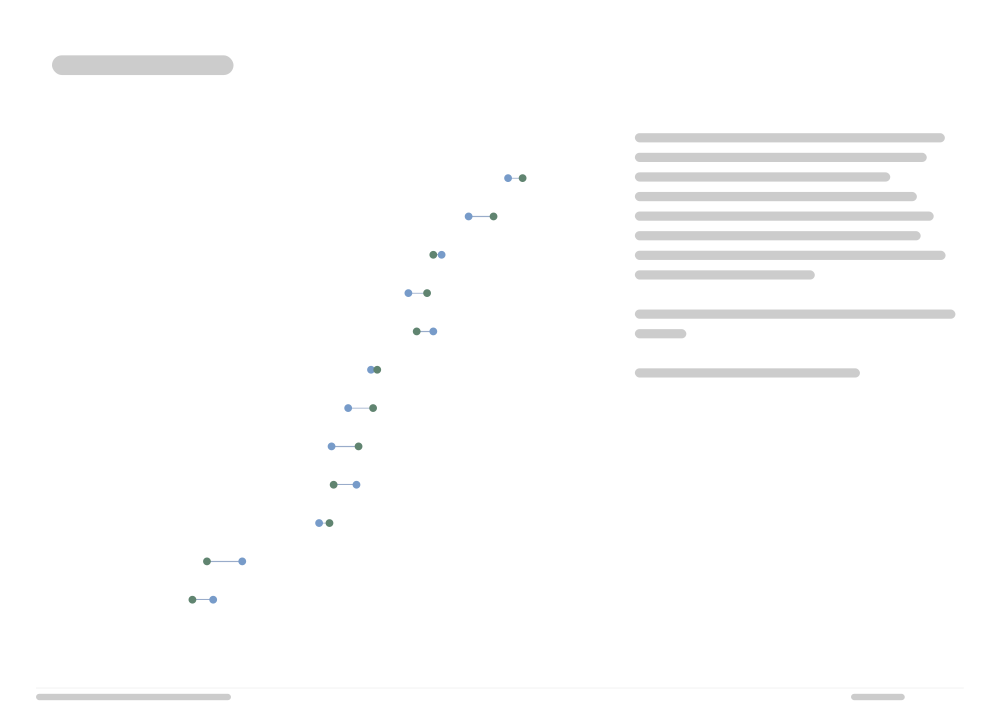
Dumbbell Chart
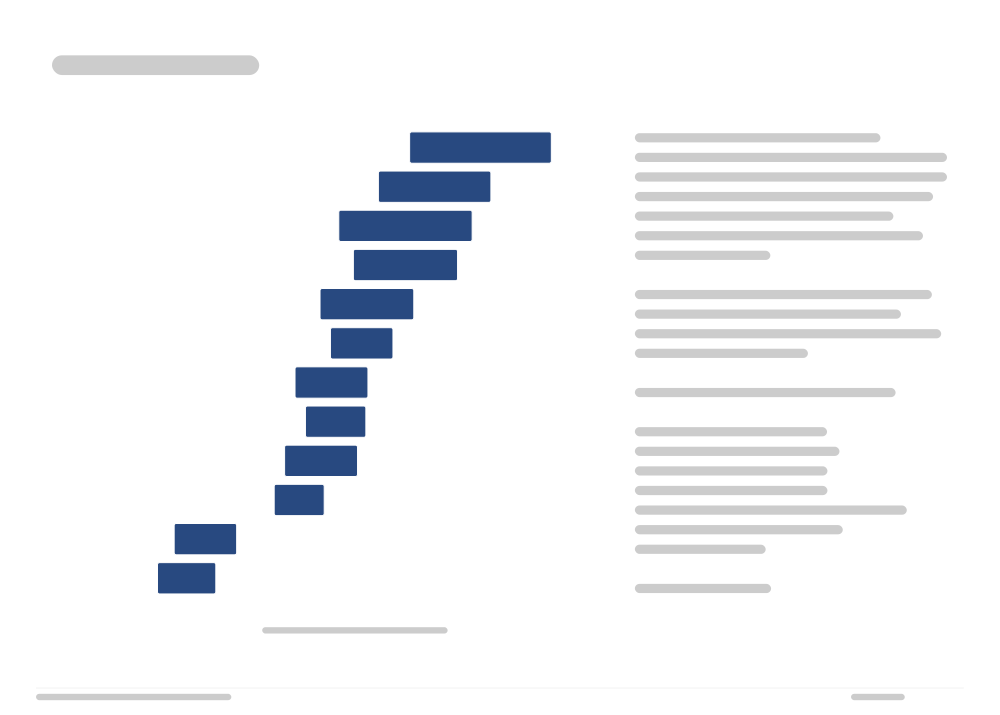
Floating Bar Chart
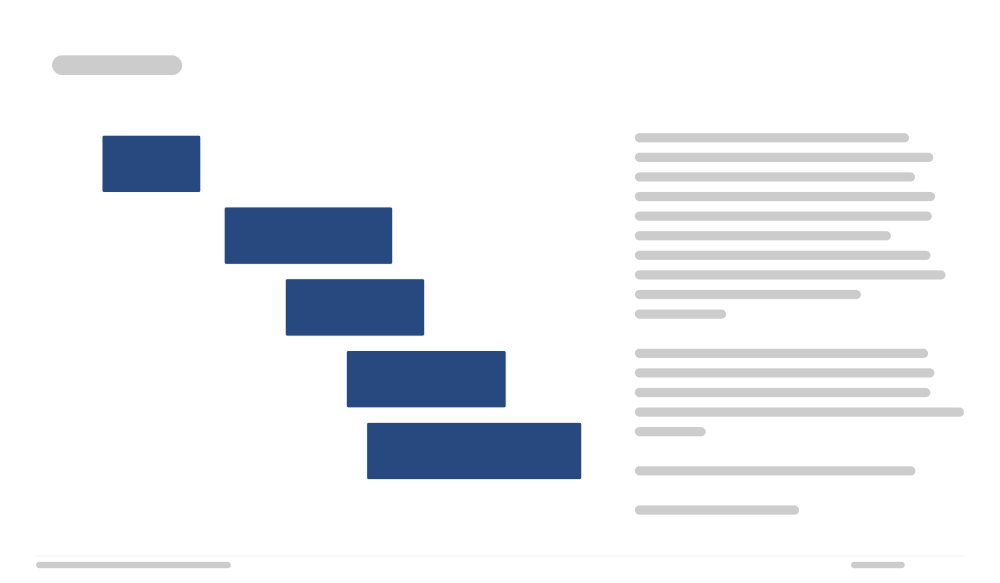
Gantt Chart
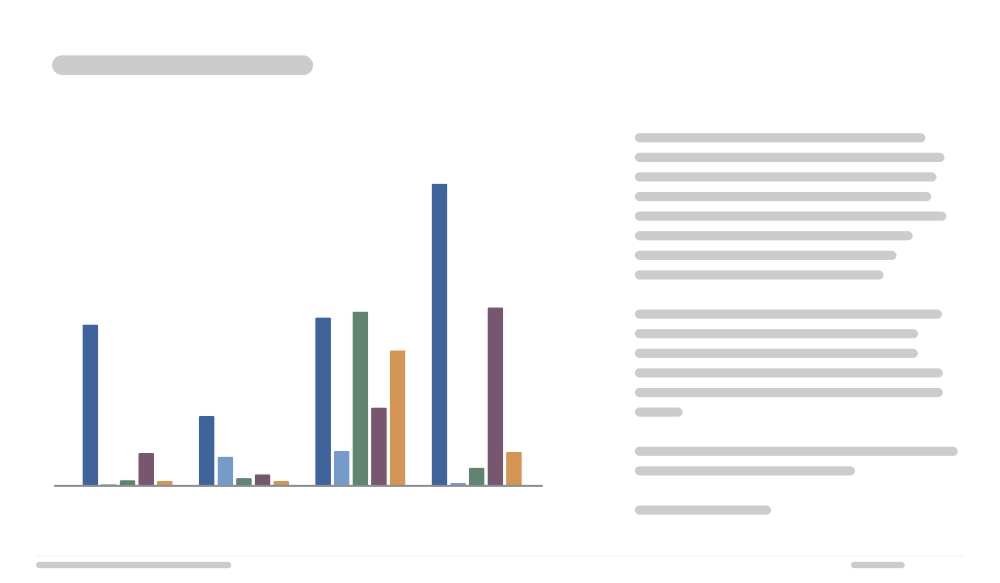
Grouped Column Chart
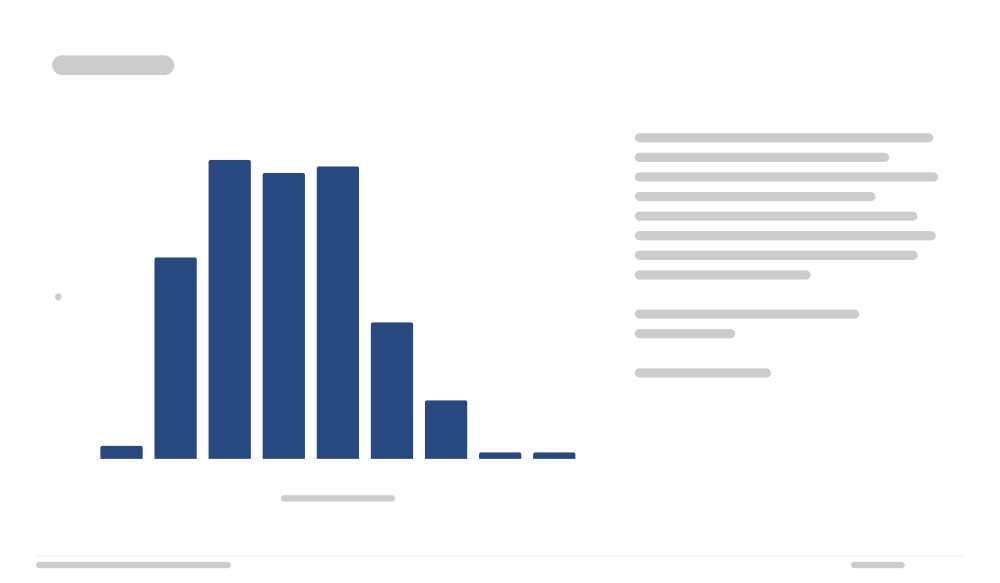
Histogram
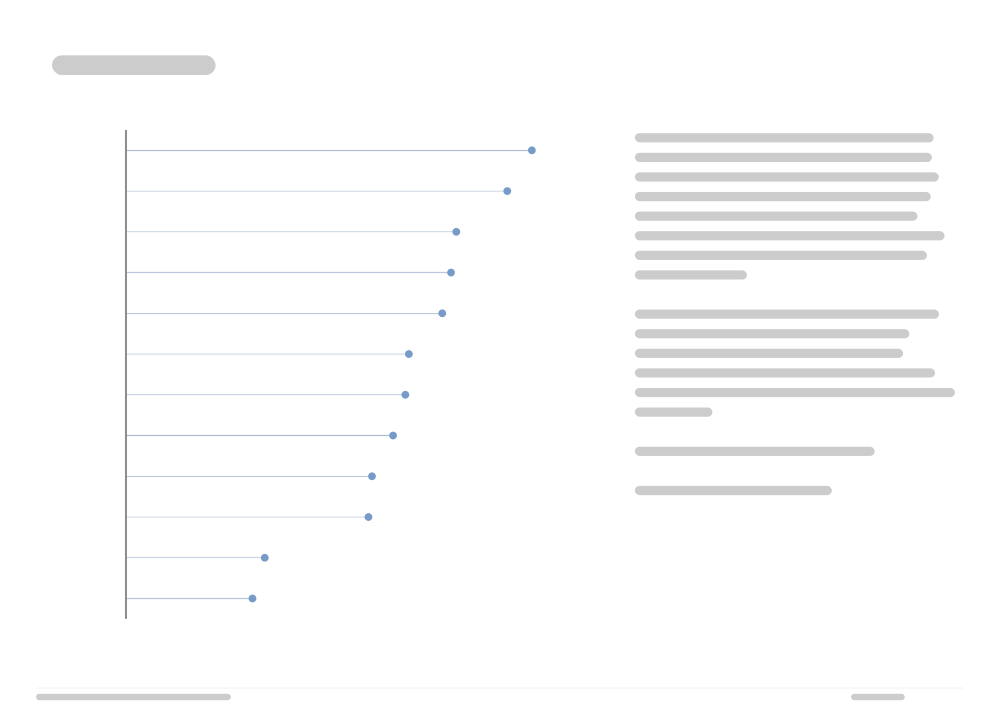
Lollipop Chart
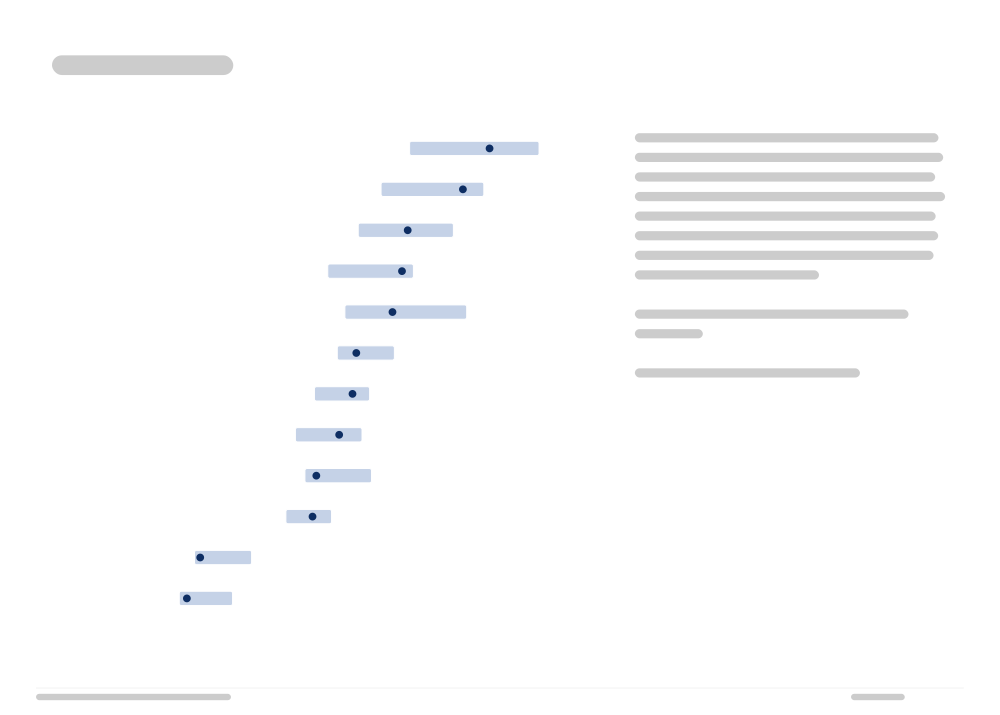
Ranged Dot Plot
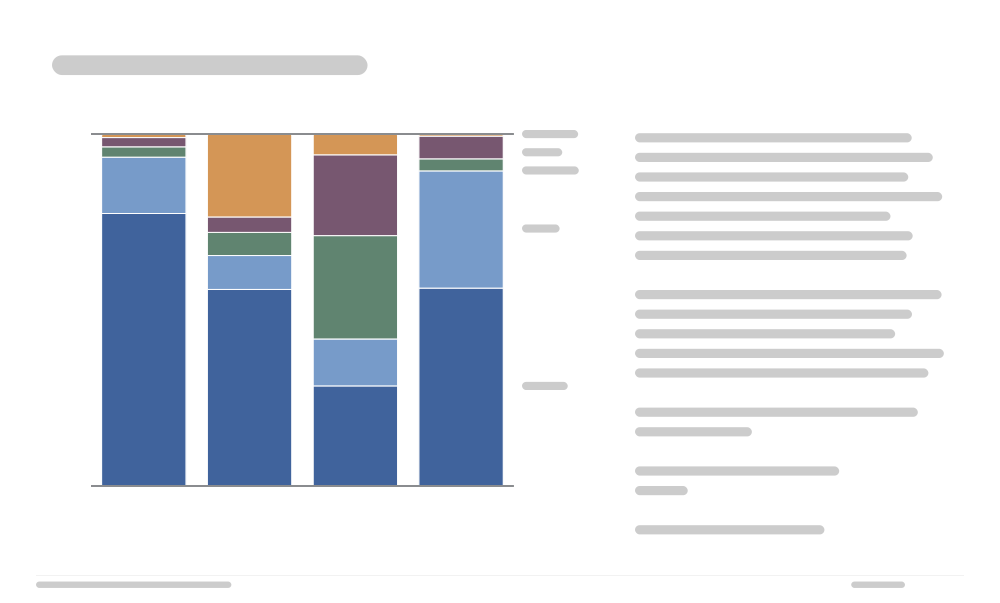
100% Stacked Column Chart
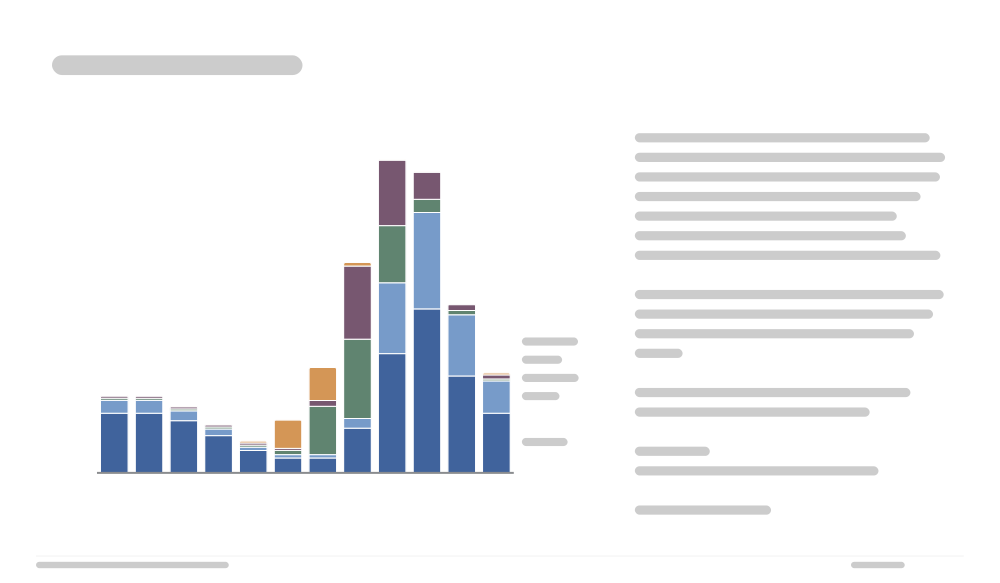
Stacked Column Chart
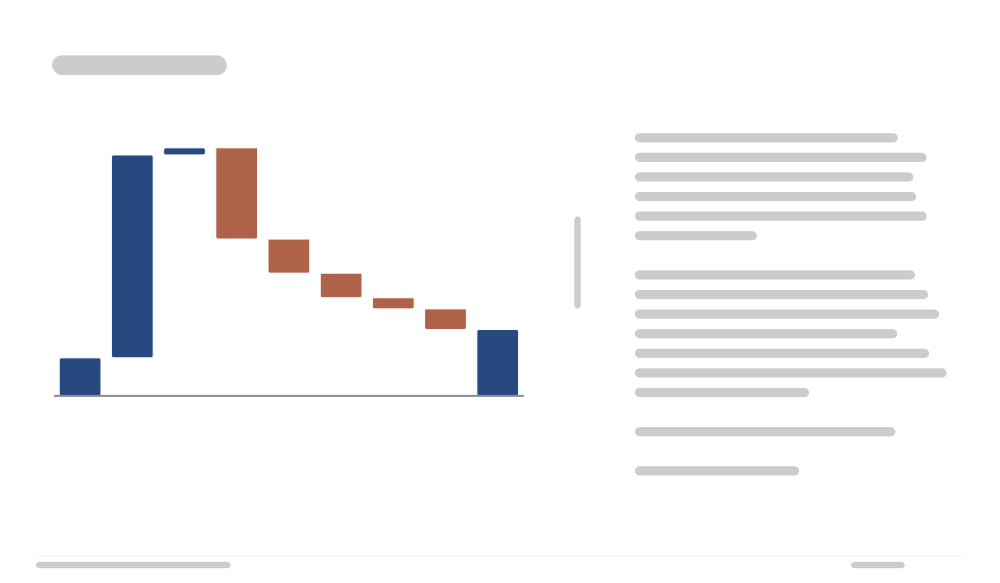
Waterfall Chart
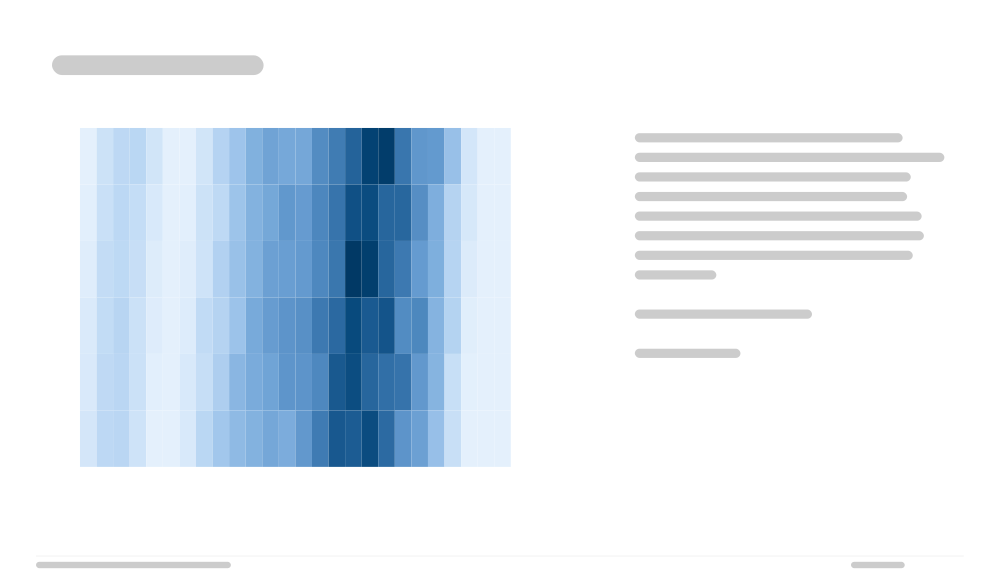
Calendar Heatmap
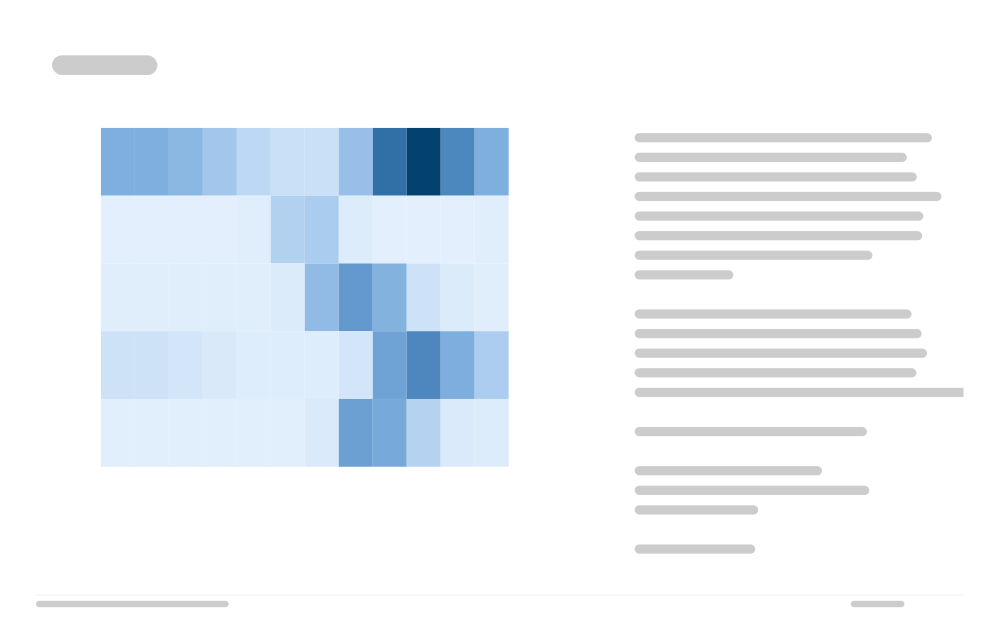
Heatmap
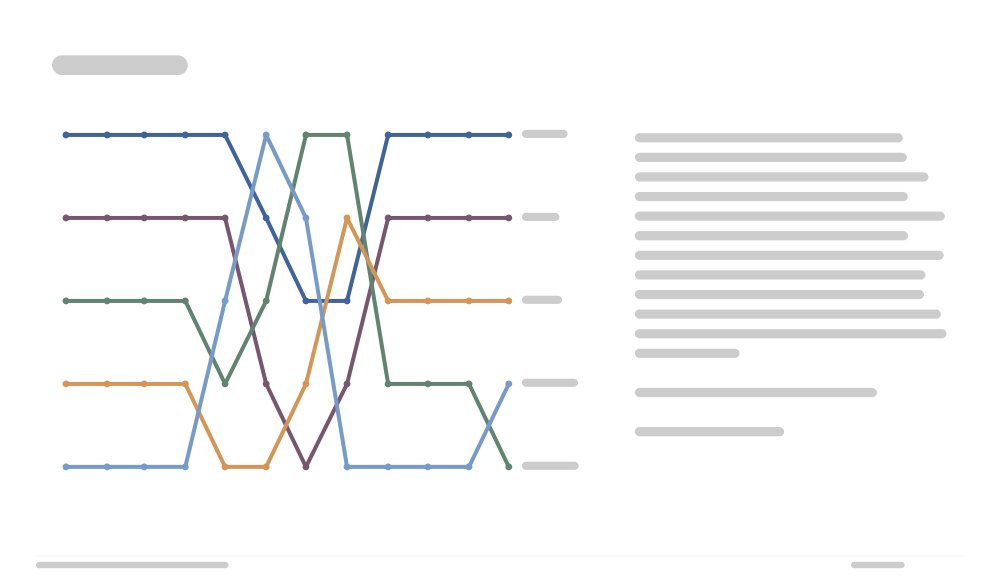
Bump Chart
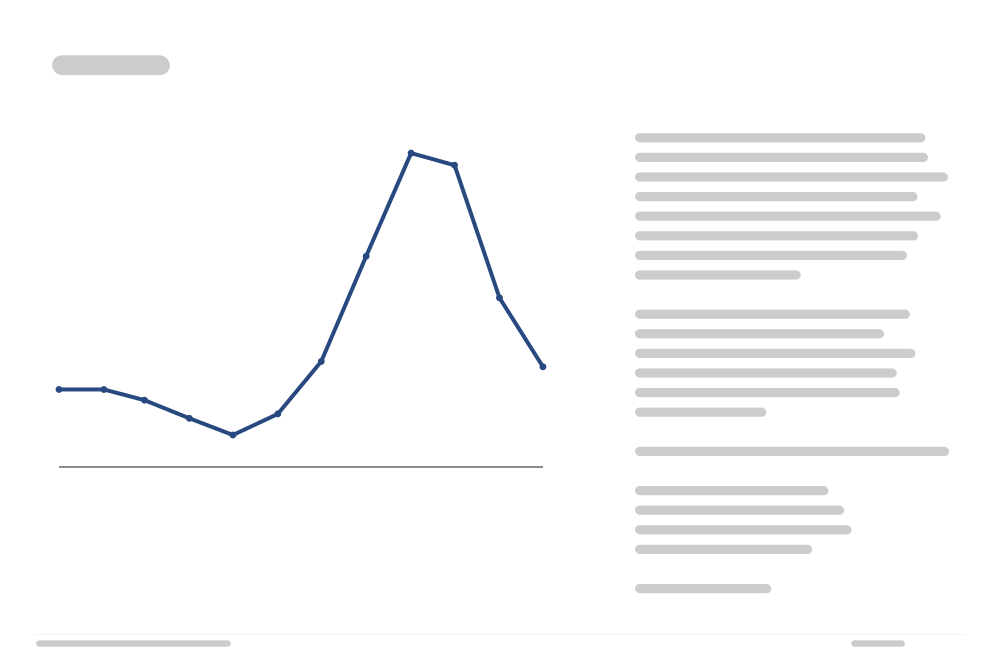
Line Chart
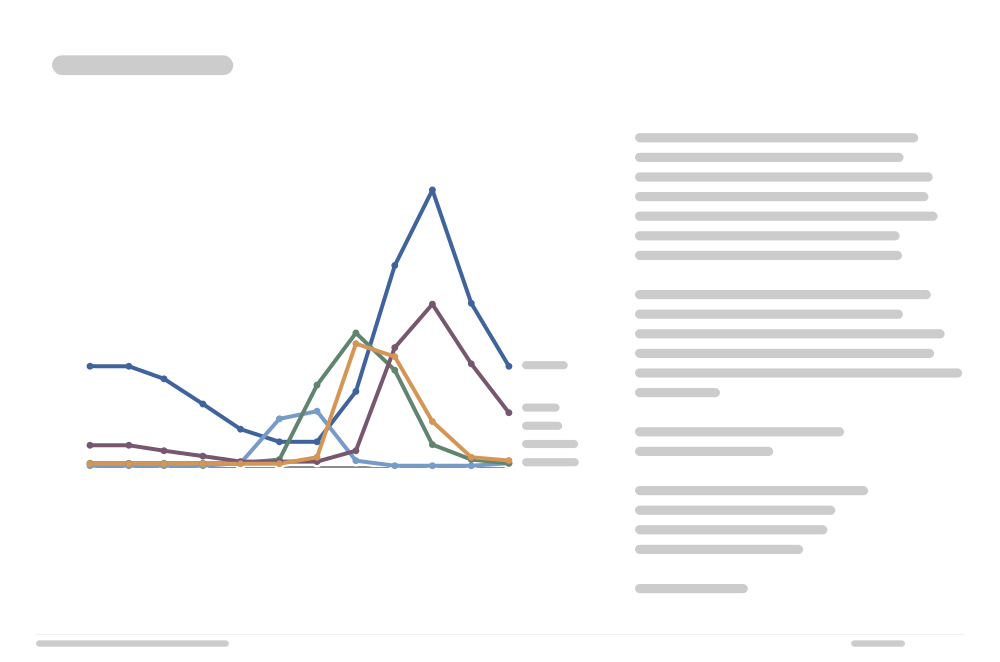
Multi-Line Chart
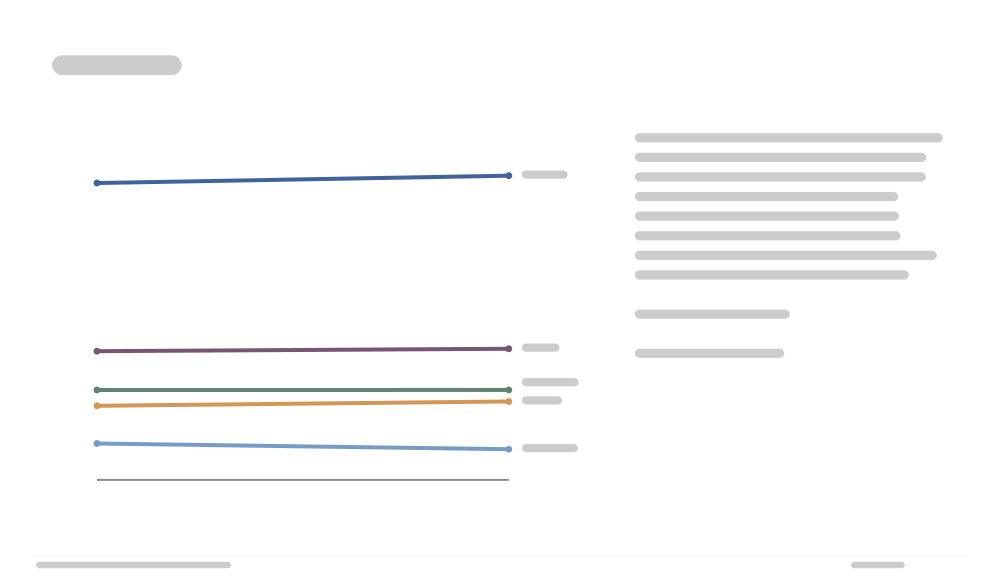
Slope Chart
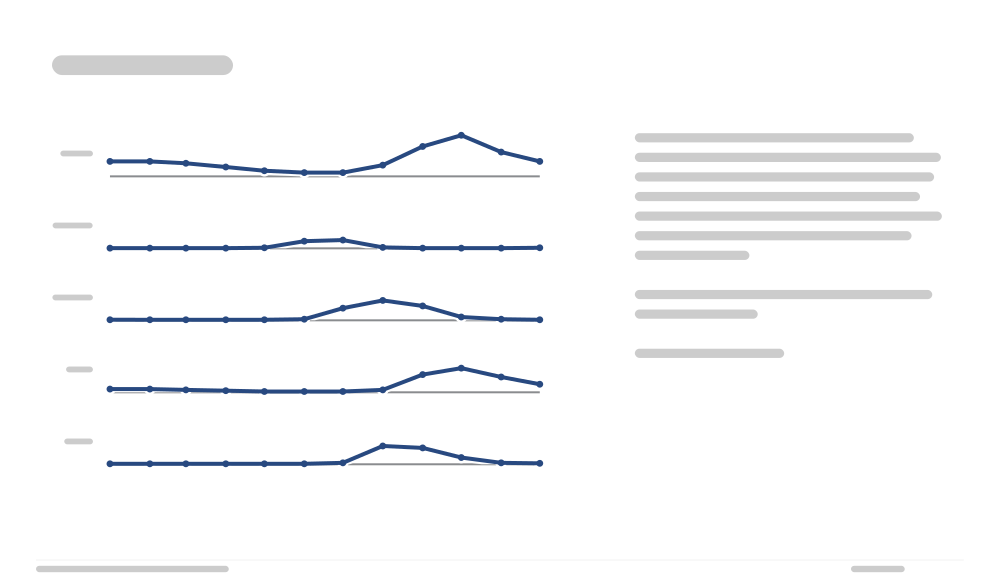
Small Multiples
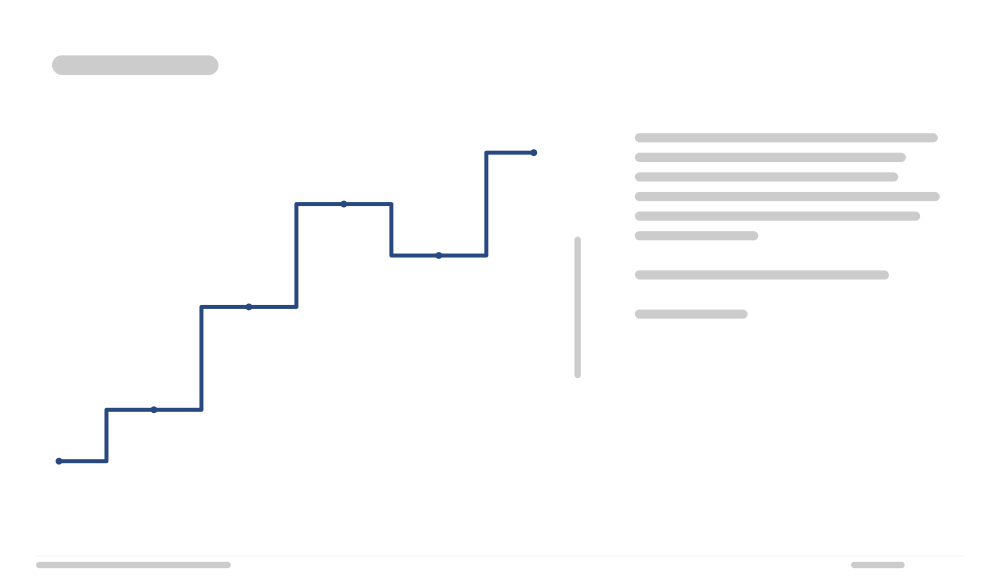
Step Line Chart
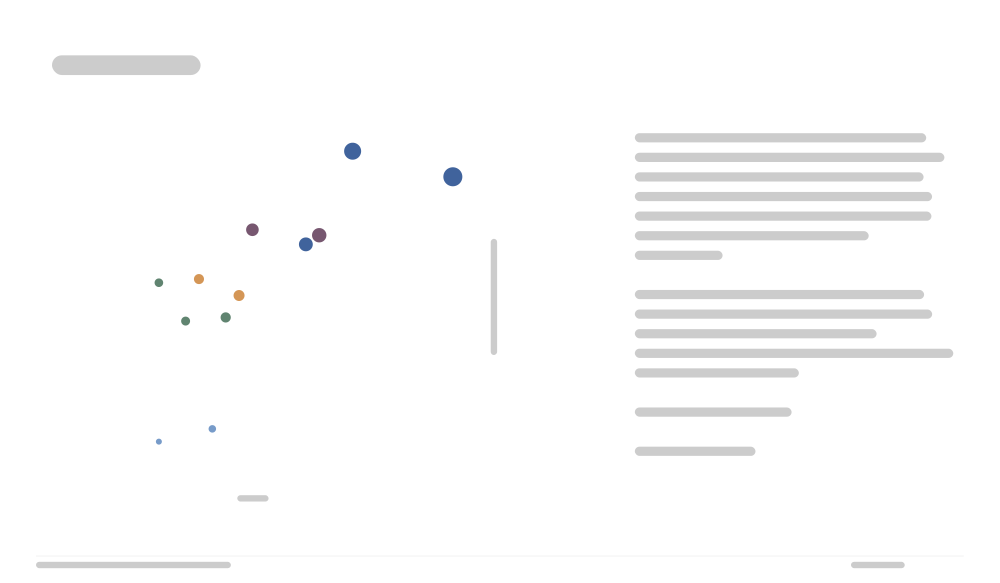
Bubble Chart
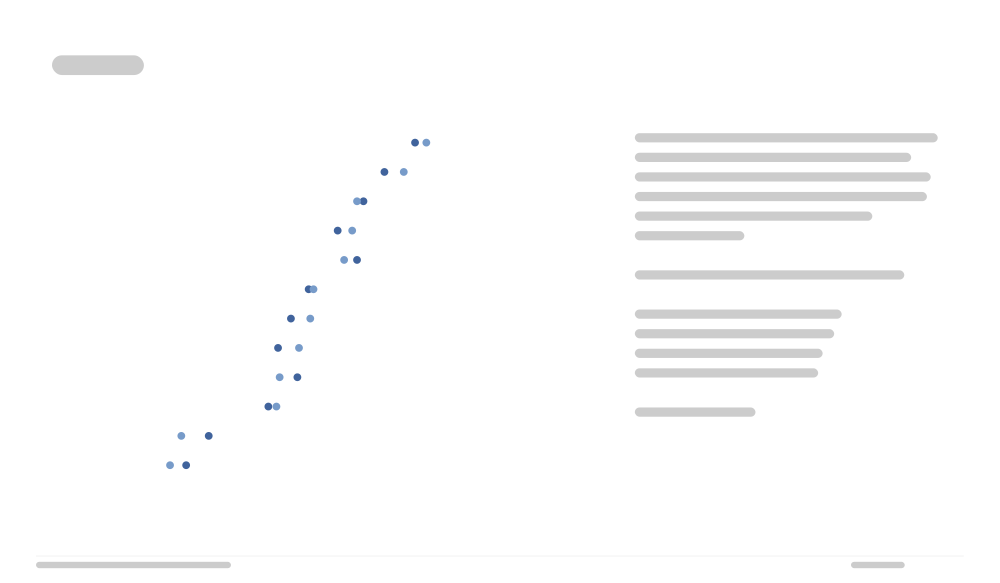
Dot Plot
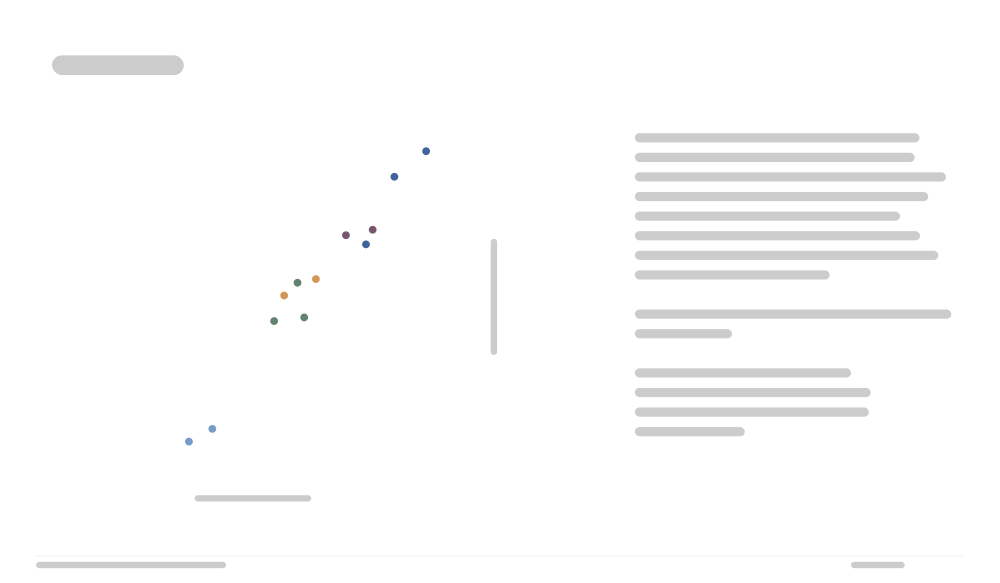
Scatter Plot
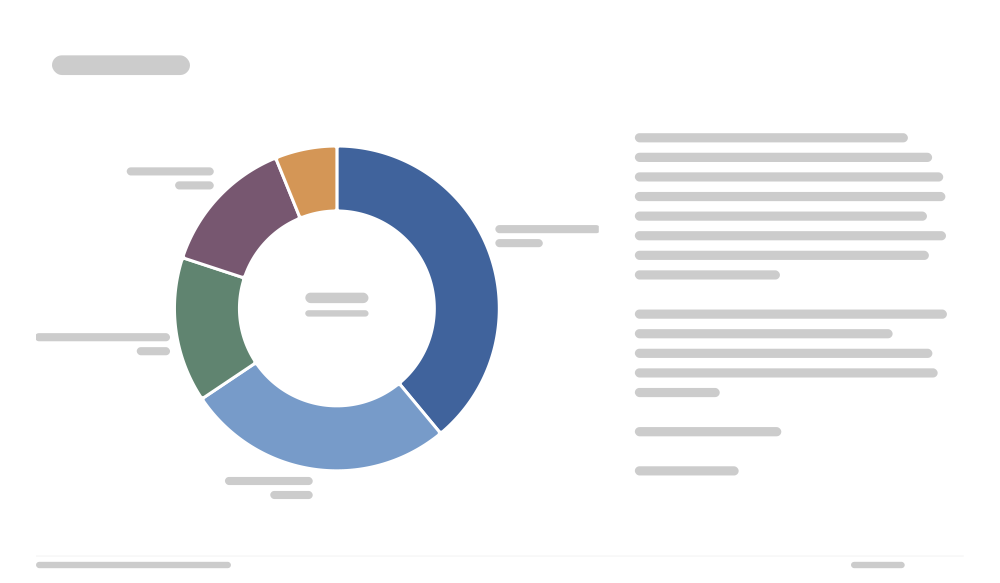
Donut Chart
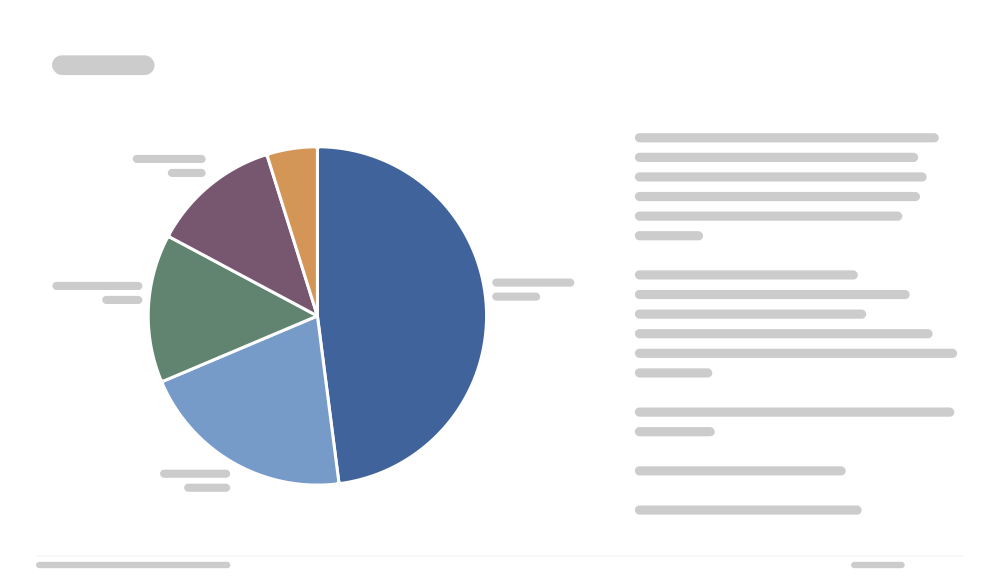
Pie Chart
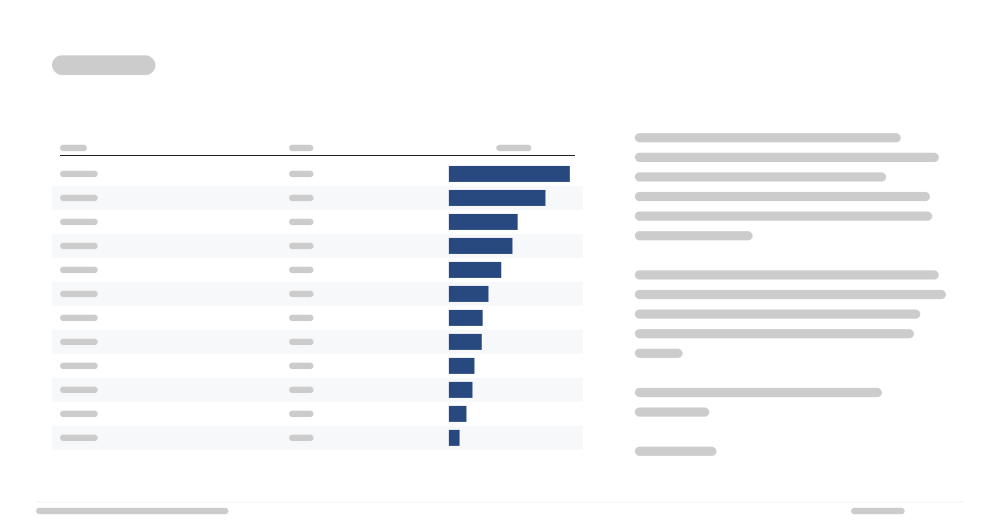
Bar Table
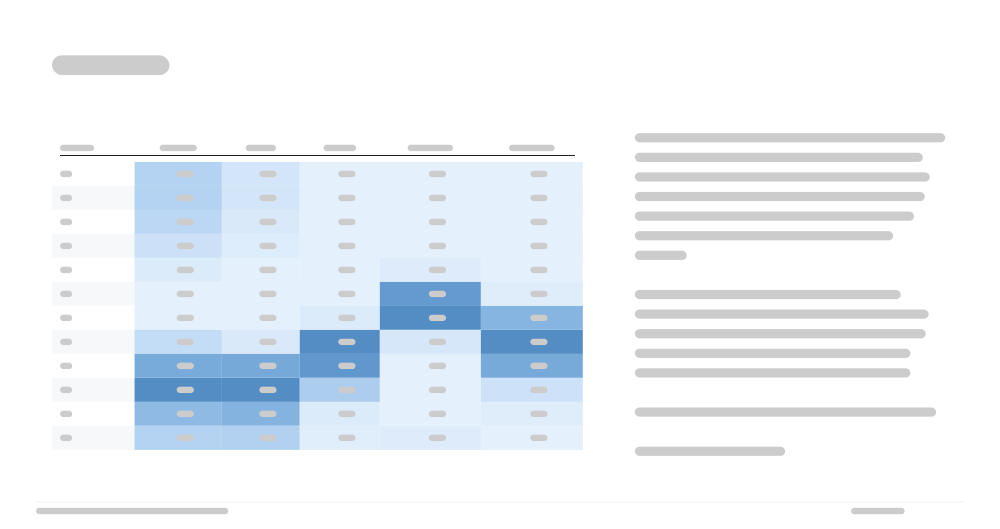
Heat Table

KPI
Pivot Table
Spark Bar
Sparkline Table
Table